Analysis of Four Scenarios in the Crude Oil Market Under the Iran Situation
Author: Jianwei Zhizhuo Miscellaneous Talks
The US-Iran dispute flares up again, driving crude oil and precious metals assets higher. Recent oil price increases mainly reflect geopolitical risk premiums rather than actual tightness in spot supply.
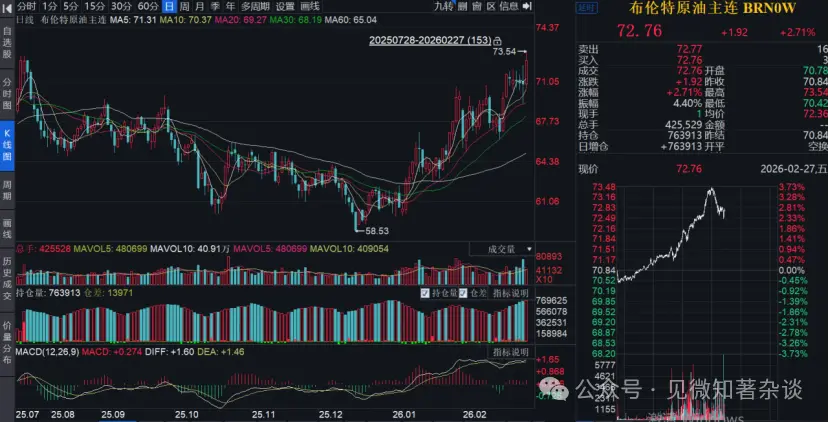
Market signals are diverging: futures prices, freight rates, and risk reversal options are rising due to risk concerns, while the futures contract spreads (calendar spreads) and physical crude oil spreads, which reflect spot supply and demand, are weakening. MS has analyzed four potential scenarios.
Scenario Analysis
·Base Case: Excluding the possibility of the Strait of Hormuz remaining permanently closed as a core scenario, which is highly unlikely and has a very low probability. The analysis framework focuses on possibilities from de-escalation to limited friction.
·Scenario 1 (No Supply Disruption): De-escalation, risk premiums fade. The estimated risk premium of about $7-9 per barrel will quickly dissipate, and Brent prices could fall back to the mid-60s.
·Scenario 2 (Limited Strikes and Short-term Logistics Friction): Targeted military actions occur but avoid energy infrastructure. This could cause a temporary supply disruption of 0-0.5 million barrels per day for 1-3 weeks. Oil prices may spike briefly to the mid-70s, but China’s slowing strategic reserve buildup will be a key balancing factor, and prices will then return to the low-60s.
·Scenario 3 (Partial Iran Export Interruption): Broader strikes cause localized disruptions in Iran’s export chain but do not affect Strait of Hormuz shipping. This could lead to a supply loss of 0.8-1.5 million barrels per day for 4-10 weeks. Price movements would be between Scenarios 2 and 4.
·Scenario 4 (Fleet Efficiency Shock and Shipping Damage): Tail risk. Iran retaliates by harassing ships, reducing shipping efficiency and causing delays. This effectively results in a supply tightness of 2-3 million barrels per day for several weeks, similar to early 2022 price spikes but likely shorter in duration.

·Scenario 1 (No Supply Disruption): De-escalation, risk premiums fade. The roughly $7-9 per barrel risk premium will quickly disappear, and Brent prices could fall back to the mid-60s. (Significant likelihood)**
The first scenario, “No Supply Disruption: De-escalation and Risk Premium Dissipation,” is set as a plausible reference case. The core assumption is that the current US military deployment and diplomatic pressure in the Middle East are sufficient to persuade Iran to negotiate on nuclear issues, avoiding direct military conflict. Negotiations may be lengthy and gradual; military threats mainly serve as leverage rather than a prelude to actual action. Sanctions may remain strict but without imposing additional restrictions that materially affect Iran’s current export flows.
Thus, this scenario does not impact physical crude supply: Iran’s exports remain roughly at recent levels, and regional transportation through the Strait of Hormuz remains unimpeded. The main market impact is the disappearance of the geopolitical risk premium embedded in front-end prices. Regression analysis of OECD commercial inventories and Brent calendar spreads (M1-M4) over the past 25+ years indicates that current inventory levels should correspond to a market structure of contango or slight premium, not backwardation. Currently, Brent M1-M4 spreads are about $1.75 per barrel; if the market clearly perceives no physical supply interruption, this spread could revert toward zero, consistent with regression estimates.
This implies that if the front of the futures curve shifts to a positive spread and the distant prices remain stable, the spot Brent price could decline from around $70 to the mid-60s. Accordingly, about $7-9 per barrel of geopolitical risk premium could dissipate relatively quickly in a de-escalation scenario. Most price adjustments would occur over days or weeks, not months, especially if market participants are confident that regional supply and transportation will remain uninterrupted.
Historical precedent from June 2025, after the Iran-Israel conflict, shows that oil prices surged on fears of escalation but quickly returned to pre-conflict levels within weeks once infrastructure and transportation were confirmed unaffected. This confirms that when physical supply is intact, risk premiums can form and dissipate very rapidly. Ultimately, volatility will compress, and market pricing will shift from geopolitical risk premiums back to fundamentals of supply and demand.
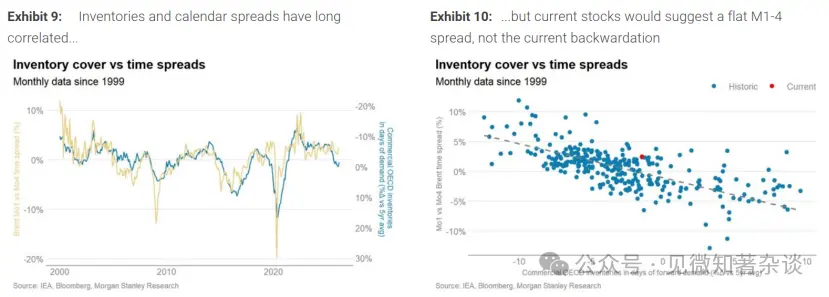
Figures 9 & 10:
- Inventory levels are closely correlated with calendar spreads over the long term.
- Current inventory levels suggest M1-M4 spreads should be near zero or slightly positive, not in backwardation as observed now.
- The recent sharp widening of the front-end spreads and risk reversal options, alongside weakening physical spreads, reflects market hedging of geopolitical risk premiums and tail risks, rather than immediate physical scarcity.
Recent Developments and Scenarios
Over the past weeks, reports indicate significant US military buildup in the Middle East, including additional tactical aircraft squadrons (F-15, F-35, F-22), refueling aircraft, early warning radars, and enhanced naval deployments.
The USS Abraham Lincoln has arrived in the Gulf, with the Gerald R. Ford carrier strike group en route. BBC reports this is the largest US military deployment in the region since the 2003 Iraq invasion.
In this context, we outline the following scenarios:
Before delving deeper, note that while a sustained closure of the Strait of Hormuz is possible, it is not considered a core scenario due to its high threshold and very low likelihood. The US Fifth Fleet based in Bahrain, with extensive air and naval capabilities, makes a prolonged closure difficult to sustain. Attempts to close would also harm Iran economically, as its exports depend on these waters, and could threaten supplies to key customers like China, likely provoking broad international reactions.
Therefore, consistent with historical experience, we focus on scenarios ranging from de-escalation to limited friction, partial Iran export chain disruptions, and operational/shipping restrictions (rather than sustained closure).
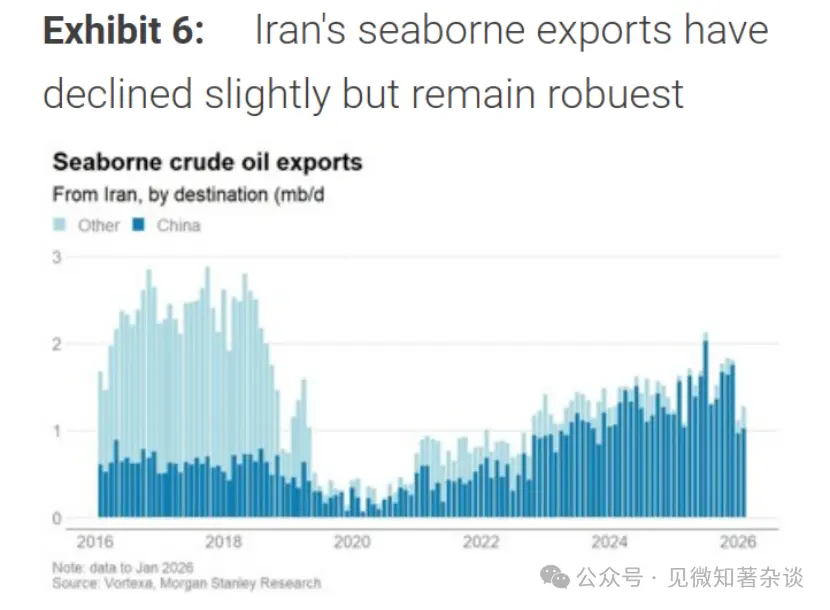
Figures 11-13:
- Iran’s shipping exports have slightly declined but remain robust.
- About 15 million barrels per day of crude and 5 million barrels per day of refined products are shipped through the Strait of Hormuz.
Scenario 1 - No Supply Disruption: De-escalation and Risk Premium Dissipation
- Reference scenario; significant likelihood
- No impact on production or exports
- Risk premium of $7-9 per barrel dissipates: Brent price falls to the mid-60s
In this scenario, diplomatic pressure combined with US military deployment persuades Iran to negotiate on nuclear issues, avoiding direct conflict. Negotiations may be lengthy but gradual; military threats serve as leverage rather than prelude to actual action. Sanctions remain strict but do not impose additional restrictions on current exports.
Physical supply remains largely unchanged. Iran’s exports stay near recent levels, and regional shipping through the Strait remains open. The main market effect is the removal of the geopolitical risk premium embedded in front-end prices.
Regression analysis of OECD inventories and Brent calendar spreads over 25+ years suggests current inventory levels should correspond to a market structure of contango or slight premium, not in backwardation. Brent M1-M4 spreads are about $1.75; if the market perceives no physical disruption, this spread could revert toward zero, implying spot Brent prices could fall from around $70 to the mid-60s.
Historical example from June 2025 shows that after initial price spikes due to fears of escalation, prices quickly returned to pre-conflict levels once infrastructure was confirmed unaffected, illustrating how risk premiums can form and dissipate rapidly when physical supply is intact. Volatility compresses, and market focus shifts back to fundamentals.
Figures 14 & 15:
- The relationship between inventories and calendar spreads over time.
- Current inventory levels imply M1-M4 spreads should be near zero, not in backwardation.
Scenario 2 - Limited Strikes and Short-term Logistics Friction
- Significant likelihood
- Possible temporary disruptions of 0-0.5 million barrels per day for 1-3 weeks
- Brent prices temporarily rise to mid-70s, then normalize to low-60s
- China’s inventory buildup slowdown is a key balancing factor
This scenario assumes targeted US military actions avoiding infrastructure, with Iran responding in a calibrated manner to deter escalation. Regional actors avoid direct involvement, and shipping through the Strait continues without sustained interruption.
Supply impacts would mainly stem from minor logistics frictions—such as cautious shipping, delays, insurance premiums, and self-imposed trade restrictions—rather than infrastructure damage. The disruption is expected to be mild, around 0-0.5 million barrels per day, lasting 1-3 weeks, or possibly none at all, as seen in June 2025.
Even if temporary shortages occur, Saudi and UAE spare capacity can offset them, limiting long-term physical imbalance. Initial market reaction would likely push Brent prices into the $75-80 range, with futures spreads widening.
The key balancing mechanism is on the demand side, especially inventory behavior. Over the past six months, China’s implied crude inventory accumulation averaged about 0.8 million barrels per day. Under higher prices and deeper backwardation, China’s strategic reserve buildup may slow.
When Brent reaches the mid-70s, inventory accumulation will likely slow from recent high levels (around 0.3 million barrels per day), enough to offset Iran’s temporary 0.5 million barrels per day export loss.
Market response would be “front-loaded”: prices spike initially due to risk premiums, but as logistics friction eases, OPEC’s idle capacity reassures the market, and China’s inventory demand slows, futures curves and prices would compress again toward $60. This normalization could take weeks or months but is unlikely to cause sustained, substantial price increases.
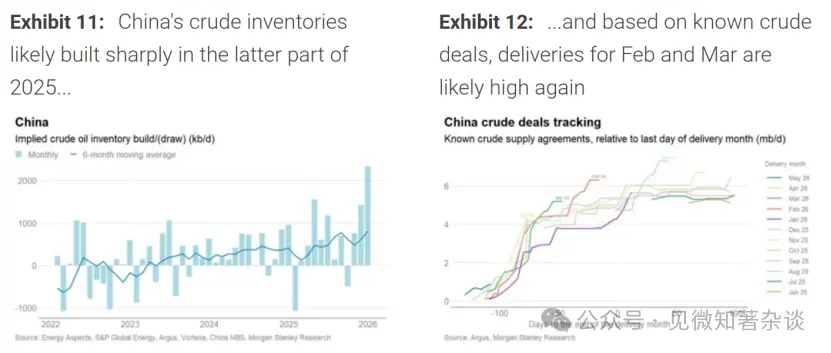
Figures 16-17:
- China’s crude inventories could build significantly in late 2025.
- Delivery volumes in February and March might again be high based on known trading patterns.
Scenario 3 - Partial Iran Export Interruption: Broader Strikes but No Shipping Damage
- Low probability of escalation
- Disruption of 0.8-1.5 million barrels per day for 4-10 weeks
- Price movements between Scenarios 2 and 4
In this scenario, the US conducts broader military operations targeting more extensive Iranian assets, but regional actors avoid direct involvement, and shipping through the Strait remains operational without sustained damage (no persistent escort or systemic shipping disruptions). Infrastructure is not the primary target, but the scale of action causes localized, substantial disruptions in Iran’s export chain.
Operational disruptions could include intermittent loading at key terminals, temporary power or communication outages, and short-term logistical constraints. Sanctions tightening and self-imposed restrictions may keep exports below normal even after the conflict subsides.
The likely outcome is a significant and sustained decline in Iran’s exports—greater than Scenario 2 but less than Scenario 4—lasting about 4-10 weeks, depending on how quickly operations normalize.
Market reaction would mainly be front-end price increases, with futures spreads widening and sustained backwardation reflecting longer-lasting physical tightness. However, since shipping remains unaffected, the acute mismatch described in Scenario 4 is less probable.
The primary balancing channel would be on the supply side, with Saudi and UAE spare capacity able to offset much of the shortfall, though response speed and market confidence are critical. Higher prices and steeper backwardation would suppress autonomous inventory demand, especially in China, providing additional buffer.
Over time, as evidence shows the disruption is operational and reversible, futures curves would begin to normalize. The process might be slower than Scenario 2, possibly extending over months, until Iran’s export recovery is confirmed.
Figures 18-20:
- China’s inventory buildup could be substantial in late 2025.
- Known trading data suggest high delivery volumes in early 2026.
Scenario 4 - Fleet Efficiency Shock and Shipping Damage: Tail Risk
- Very low probability but high impact
- Iran’s maritime retaliation causes delays, reduces effective shipping capacity, leading to a supply shortfall of 2-3 million barrels per day for weeks
- Price spikes similar to early 2022, but likely shorter duration
This tail scenario assumes that after a large-scale US strike, Iran retaliates by harassing ships, seizing vessels, deploying drones, and missile demonstrations, significantly increasing shipping risks and delays. Commercial shipping continues but at reduced speeds, with higher insurance premiums, and some operators withdraw capacity temporarily. Naval escort and convoy operations may re-emerge, extending transit times.
The main impact is not from oil field shutdowns but from reduced fleet efficiency. Quantitatively, about 110 billion ton-miles of oil are transported daily via the Strait of Hormuz, with an average transit time of 29 days. Increasing transit time by 5 days would reduce effective capacity by about 17%, or roughly 20 billion ton-miles daily, equivalent to a 6% reduction in global oil shipping capacity. At current flows (~50 million barrels/day), this translates into a shortfall of 2-3 million barrels per day over several weeks.
This disruption would likely exceed the buffer provided by China’s strategic reserves and test the limits of Saudi and UAE spare capacity. Market reactions could resemble early 2022, with front-end prices soaring and futures spreads widening sharply due to traders scrambling for near-term supplies.
Unlike 2022, the primary balancing mechanism would not necessarily require a permanent reduction in end-user consumption; higher prices and steeper backwardation would suppress autonomous inventory demand and accelerate operational adjustments, helping to contain the mismatch duration.
Freight rates would also rise in tandem. As operational adjustments take effect, the effective tightness would gradually ease, but during the period of shipping disruption, prices could be well above Scenario 2 levels. The normalization process depends on the recovery of Gulf shipping security.
Price Outlook and Summary
Our core view remains anchored in Scenarios 1 and 2, where physical supply disruptions are minimal or absent. If such a scenario unfolds in the coming weeks, regression analysis suggests the geopolitical risk premium embedded in near-term Brent prices (~$7-9) could fade, leading to a flattening of the futures curve and a return to inventory levels consistent with current stocks, with spot prices falling to the low $60s.
Beyond the near term, fundamentals remain weak. Temporary disruptions (e.g., Kazakhstan, US) have tightened supply-demand balance in January more than expected, but these are reversing. Early Petro-Logistics data indicate OPEC+ production may rebound by about 1.2 million barrels per day in February.
Our baseline still points to a surplus of about 2.5 million barrels per day in early 2026, tapering to about 1.4 million barrels per day later in the year.
We estimate that roughly 800,000 barrels per day of surplus will be absorbed by Chinese inventories, but we do not assume that offshore floating storage will grow as much as in 2025. This leaves an estimated 600-1,700 thousand barrels per day of surplus to be absorbed by onshore inventories outside China, including a significant portion in OECD and Atlantic basin commercial stocks.
Historically, such inventory absorption could bring Brent’s front end into slight contango later in the year. Applying our regression models to forecast inventory trajectories suggests that while recent de-escalation could push Brent back to the low $60s, the overall inventory build in 2026 under pure fundamentals could be associated with a steeper positive spread and near-month prices approaching $50.
In practice, prices are unlikely to be driven solely by fundamentals. Recent weeks have shown that geopolitical risk premiums can provide substantial support at the front end, especially when prices weaken, creating a negative feedback loop.
Our central expectation is that, as 2026 progresses, near-term Brent prices will gradually decline toward about $60 per barrel. However, unless geopolitical risks are more clearly and durably alleviated, the scope for prices to fall significantly below that level remains limited.
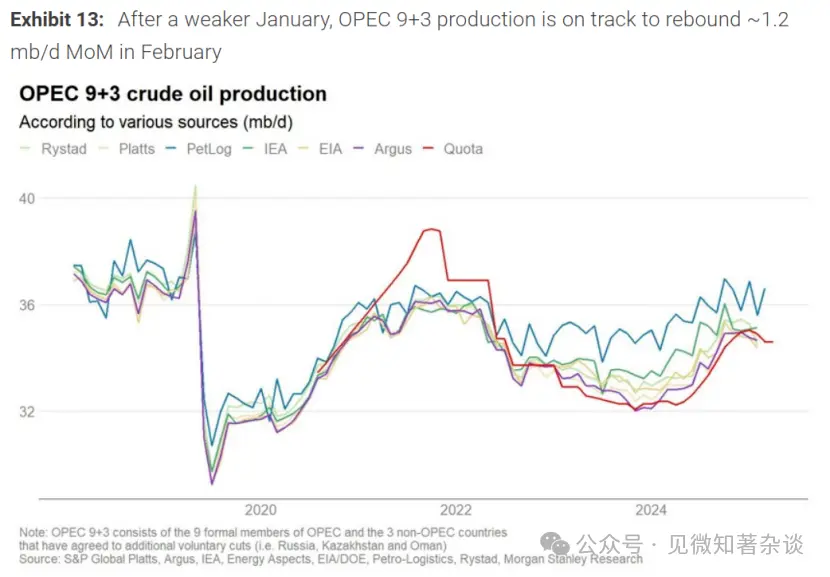
Figures 21 & 22:
- After January’s weakness, OPEC 9+3 production is expected to rebound by about 1.2 million barrels per day in February.