Hedera (HBAR) is trading below $0.101 at the time of writing on Wednesday, after failing to break through the key resistance zone at the end of last week. Derivatives market data indicate that HBAR’s recovery potential remains quite fragile: open interest (OI) continues to decline, and the funding rate remains negative, reflecting cautious investor sentiment. In this context, current technical signals do not support a clear bullish scenario for Hedera.
Hedera Derivatives Data Shows Downtrend
Hedera futures open interest (OI) dropped to $104.58 million on Wednesday, extending the weakening trend that began in early January. Notably, this indicator is approaching the February 6 low of $88.89 million. The prolonged decline in OI suggests decreasing participation from investors and indicates a less optimistic short-term price outlook.
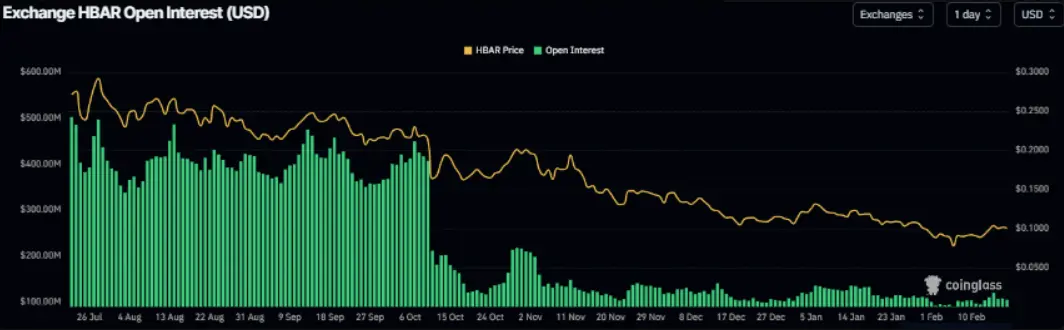 HBAR Open Interest Volume Chart | Source: CoinglassAdditionally, the funding rate data, weighted by OI from Coinglass, shows that the bearish prediction for Hedera continues to dominate over bullish expectations. The indicator turned negative on Monday and fell sharply to -0.011% on Tuesday. Negative funding rates mean short positions pay fees to long positions, emphasizing the prevailing bearish market sentiment toward HBAR.
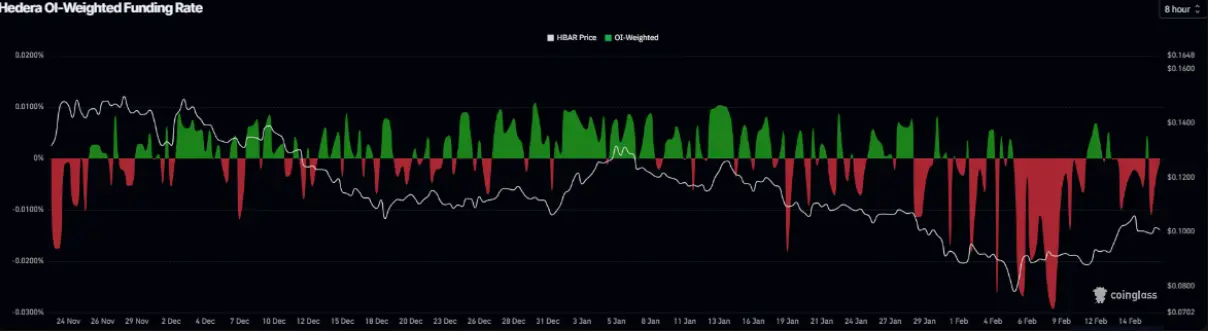 HBAR Funding Rate Chart | Source: Coinglass## Hedera Price Forecast: Rejected at Key Resistance Zone
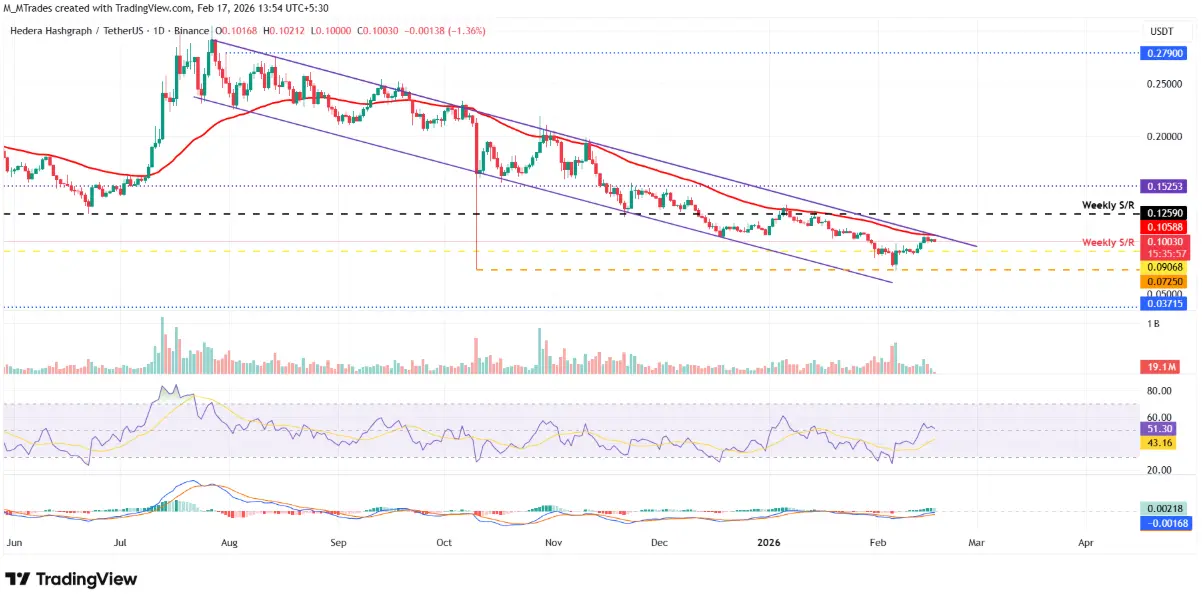
Hedera’s price faced strong selling pressure around the 50-day exponential moving average (EMA) at $0.105 on Saturday, before slightly retracing in the following session. Notably, the 50-day EMA nearly coincides with the upper trendline of a descending wedge pattern — formed by connecting the peaks and troughs since late June — reinforcing this zone as a significant resistance area. As of Wednesday, HBAR is trading around $0.010.
In a continued correction scenario, HBAR’s price is likely to retreat toward the weekly support zone at $0.090. If selling pressure is strong enough to close below this level, the decline could extend to the next support at $0.072 — the low established on October 10.
 Daily HBAR/USDT Chart | Source: TradingView
Regarding momentum, the relative strength index (RSI) on the daily timeframe is currently around 51 and trending downward toward the neutral 50 level, indicating that buying power is gradually waning. For a sustained downtrend, RSI would need to break below this neutral threshold. On the positive side, the MACD indicator still shows a bullish crossover triggered on February 10, suggesting that the upward trend has not been entirely invalidated.
Conversely, if HBAR regains momentum and successfully closes above the 50-day EMA at $0.105, the price could continue upward to test the next weekly resistance zone around $0.125.
Disclaimer: The information on this page may come from third parties and does not represent the views or opinions of Gate. The content displayed on this page is for reference only and does not constitute any financial, investment, or legal advice. Gate does not guarantee the accuracy or completeness of the information and shall not be liable for any losses arising from the use of this information. Virtual asset investments carry high risks and are subject to significant price volatility. You may lose all of your invested principal. Please fully understand the relevant risks and make prudent decisions based on your own financial situation and risk tolerance. For details, please refer to
Disclaimer.
Related Articles
BTC 15分钟上涨0.62%:地缘冲突推升避险需求与链上资金共振驱动上行
2026-03-13 16:30 至 2026-03-13 16:45(UTC),BTC价格在71379.5 USDT至71870.0 USDT区间波动,15分钟内收益率录得+0.62%,振幅达到0.69%,带动市场关注度显著升温。短线资金活跃,波动节奏加快,显示市场避险情绪占据主导。
本次异动的主要驱动力是全球宏观地缘冲突升级引发油价飙升,触发传统风险资产普遍承压。美股等主流市场出现资金流出
GateNews3m ago
PEPE Consolidates Above $0.05324 Support as Momentum Strengthens and Resistance Near $0.05336 Holds
PEPE has a tight intraday price compression with a support level of $0.053243 and resistance level of $0.053363.
A RSI of 64.13 represents the moderate bullish momentum whereas MACD history is slightly positive, which indicates the gradual buying momentum.
The price is at $0.053364
CryptoNewsLand12m ago
HYPE Hits $35.53 After 2.4% Jump — Will Momentum Hold as Price Tests $35.59 Resistance?
Hyperliquid’s HYPE trades at $35.53, approaching the $35.59 resistance after a 2.4% daily gain.
The chart shows the $33.67 zone acting as support after price moved above a previously contested level.
Price now trades between $33.67 support and $35.59 resistance, shaping the immediate
CryptoNewsLand21m ago
TAO Price Pumps Another 20% as Bittensor Delivers What No Other AI Crypto Could
Bittensor's TAO token surged 20% today, achieving over 60% gains in the last month, following the completion of a groundbreaking decentralized language model. Market sentiments are high, signaling strong investor interest in Bittensor's technology.
CaptainAltcoin46m ago
BTC 15分钟下跌0.67%:宏观避险情绪与衍生品去杠杆共振放大卖压
2026年3月13日15:30至15:45(UTC),比特币(BTC)在71886.1至72602.0 USDT区间震荡,振幅0.99%,最终15分钟内下跌0.67%。该时段成交量较前一小时显著放大,多头仓位出现集中止损,短线波动引发市场高度关注,情绪维持极度谨慎。
本次异动的主要驱动力在于全球地缘政治局势紧张和通胀预期走高。美国与伊朗冲突升级导致布伦特原油价格维持在100美元/桶以上,市场对
GateNews1h ago
BTC 15分钟下跌1.06%:油价冲击与杠杆强平共振引发抛售压力
2026-03-13 14:30 至 14:45(UTC),BTC在15分钟内收益率录得-1.06%,K线价格区间为72933.4至73896.0 USDT,振幅达1.31%。短时间市场波动明显加剧,交易活跃度与关注度同步走高。
本次异动的主要驱动力是全球油价因美以对伊朗军事行动急飙至100美元上方,触发通胀预期升温和美联储降息可能性的下降,导致全球风险偏好大幅回撤。比特币作为流动性最强的风险
GateNews2h ago