Date: Sun, Dec 28, 2025 | 09:40 AM GMT
The broader cryptocurrency market is showing modest strength, with both Bitcoin (BTC) and Ethereum (ETH) trading in the green. This steady performance among major assets has helped stabilize overall sentiment, allowing select memecoins — including SPX6900 (SPX) — to begin showing constructive technical setups.
SPX is trading with a modest intraday gain, but more importantly, its price structure is starting to reflect a classic bullish reversal pattern. After weeks of sustained downside pressure, buyers appear to be stepping back in at key levels, hinting that the worst of the correction may already be behind.
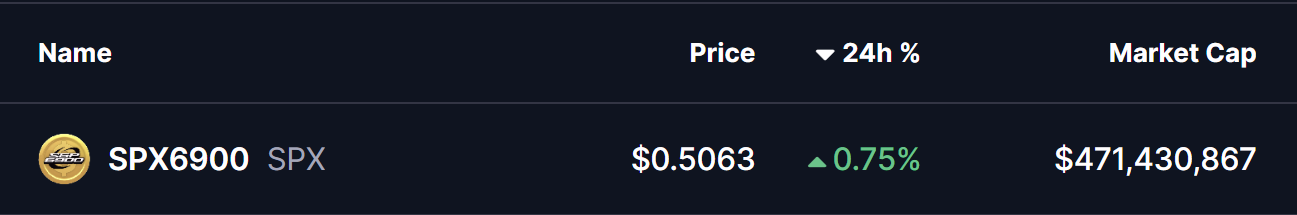
Source: Coinmarketcap
Double Bottom Pattern in Play
On the daily timeframe, SPX is forming a double bottom pattern — a widely followed bullish reversal structure that often appears near the end of prolonged downtrends. The first bottom formed in November when SPX dropped toward the $0.45 region, followed by a recovery that carried price back toward the neckline resistance near $0.7389 in early December.
That recovery attempt, however, was rejected, sending SPX back down to retest the same $0.45 support zone. Importantly, sellers failed to push price meaningfully lower on this second attempt. Instead, SPX printed another strong reaction from the same demand area and has since rebounded to trade around $0.5045.

SPX6900 (SPX) Daily Chart/Coinsprobe (Source: Tradingview)
This repeated defense of the same support level is a critical technical signal. It suggests that selling pressure is weakening while buyers are gradually absorbing supply — a behavior typically seen during accumulation phases before trend reversals.
What’s Next for SPX?
For the bullish structure to strengthen, SPX must reclaim the 50-day moving average, currently positioned near $0.5770. A sustained move above this level would mark an important shift in short-term momentum and increase the probability of a continued recovery toward the neckline resistance at $0.7389.
A decisive breakout above the neckline — ideally followed by a successful retest — would confirm the full activation of the double bottom pattern. In that scenario, the technical projection points toward a potential upside target near $1.02, representing a significant expansion from current price levels.
Until then, the $0.45 support zone remains the most important level to watch. As long as SPX continues to hold above this area, the broader bullish setup stays intact and allows room for further upside attempts.
Overall, SPX’s structure appears constructive. The presence of a double bottom, repeated demand at identical lows, and proximity to the 50-day moving average suggest that this could be a pivotal moment as the token attempts to transition from accumulation into a new expansion phase.
Disclaimer
The views and analysis presented in this article are for informational purposes only and reflect the author’s perspective, not financial advice. Technical patterns and indicators discussed are subject to market volatility and may or may not yield the anticipated results. Investors are advised to exercise caution, conduct independent research, and make decisions aligned with their individual risk tolerance.
About Author
Nilesh Hembade is the Founder and Lead Author of Coinsprobe, with over 5 years of experience in the cryptocurrency and blockchain industry. Since launching Coinsprobe in 2023, he has been providing daily, research-driven insights through in-depth market analysis, on-chain data, and technical research.

Disclaimer: The information on this page may come from third parties and does not represent the views or opinions of Gate. The content displayed on this page is for reference only and does not constitute any financial, investment, or legal advice. Gate does not guarantee the accuracy or completeness of the information and shall not be liable for any losses arising from the use of this information. Virtual asset investments carry high risks and are subject to significant price volatility. You may lose all of your invested principal. Please fully understand the relevant risks and make prudent decisions based on your own financial situation and risk tolerance. For details, please refer to
Disclaimer.
Related Articles
Bitcoin and Stock Correlation Returns to Normal, Safe-Haven Narrative Completely Collapses in March
In early March, Bitcoin performed strongly due to geopolitical conflict, but as Trump issued an ultimatum to Iran, panic sentiment spread across the market, causing Bitcoin and stocks to return to positive correlation and both declined. Analysts warned that this phenomenon may signal broader market stress and raised questions about Bitcoin's safe-haven characteristics.
MarketWhisper21m ago
Injective (INJ) Price Down 95% From ATH – Is History Setting Up the Next Bull Run?
Injective (INJ) has declined about 95% from its peak, resembling past crypto cycles that often experience sideways movement before recovery. Current price stabilization suggests accumulation, but a significant rally may be delayed until around October 2026, with ongoing community buybacks supporting demand.
CaptainAltcoin57m ago
Bitcoin dips back below $75,000 on the eve of the Federal Reserve decision
Bitcoin recently touched $75,000 but failed to sustain the level, pulling back to $74,000, reflecting cautious sentiment among investors ahead of the upcoming Federal Reserve interest rate decision. Geopolitical risks and elevated energy prices have driven inflation higher, affecting market expectations for rate cuts and pushing the timeline for cuts to year-end. Technical analysis shows Bitcoin remains strong but has not confirmed a decisive breakout above the $75,000 level, with limited upside potential in the near term.
区块客1h ago
US Treasury yields rose to 4.41%, stock market correction approaching, Bitcoin fell from 90,000 USD to 60,000 USD at one point
Bitcoin has experienced a sharp pullback, with traditional financial markets showing signs of following suit. Rising US Treasury yields are pushing up borrowing costs, leading to decreased risk appetite in the stock market. Bitcoin's price is currently oscillating between $65,000 and $75,000, with market concerns persisting over future volatility. Investors need to monitor the correlation between interest rates and risk assets.
GateNews1h ago
Gold Faces Largest Weekly Decline in 43 Years, Smart Money Pivots to Private Equity and Crypto Assets
Gold experienced its largest single-week decline since 1983 this week, with prices plummeting approximately $600. This decline was primarily driven by a liquidity crisis that forced institutional investors to liquidate positions, rather than weakening safe-haven demand. Capital flows are shifting toward private markets, emerging markets, and digital assets. While the long-term logic for gold has not completely collapsed, it's necessary to observe whether market structure stabilizes.
MarketWhisper1h ago
XRP Price Action Hovers at Critical Support - U.Today
XRP is at a critical support level, with signs of potential reversal indicated by bullish divergence in the RSI. Despite a recent downtrend, strong retail demand is driving accumulation, setting XRP apart in a challenging market.
UToday1h ago
