
Date: Fri, Dec 26, 2025 | 06:30 PM GMT
The broader cryptocurrency market has been navigating a period of choppy and uncertain price action over the past several weeks, a phase that began after the sharp market-wide sell-off on October 10. During that correction, Ethereum (ETH) dropped nearly 28% over the last 60 days, applying sustained pressure across the altcoin sector — including ether.fi (ETHFI).
ETHFI has mirrored this weakness, sliding more than 31% over the same period. However, despite the sharp downtrend, recent price behavior suggests selling pressure may be easing. The token is now trading near a historically significant demand zone, where buyers have repeatedly stepped in before — raising the possibility that ETHFI could be approaching an inflection point.
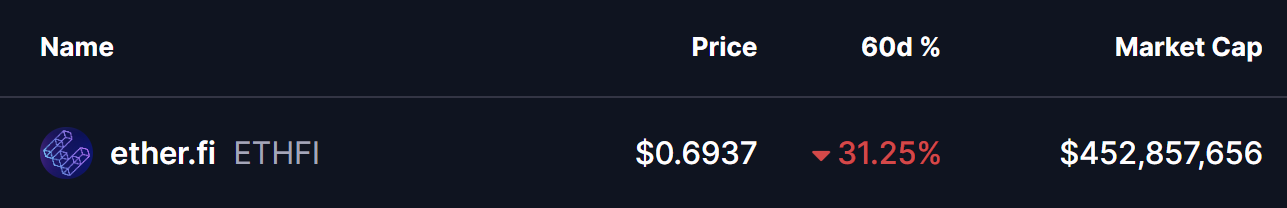
Source: Coinmarketcap
Double Bottom Pattern in Focus
On the daily timeframe, ETHFI appears to be forming a potential double-bottom structure — a classic reversal pattern that often signals exhaustion among sellers. The setup began after ETHFI was rejected from the $0.9233 resistance area, a move that triggered a sharp decline of nearly 28% and pushed price back toward the lower end of its range.
That sell-off dragged ETHFI into the $0.65 support zone, a level that has consistently acted as a strong demand area in the past. The chart now shows price revisiting this same region and stabilizing once again, suggesting buyers are actively defending it. The similarity between the first and second lows strengthens the case that a double-bottom base may be forming.
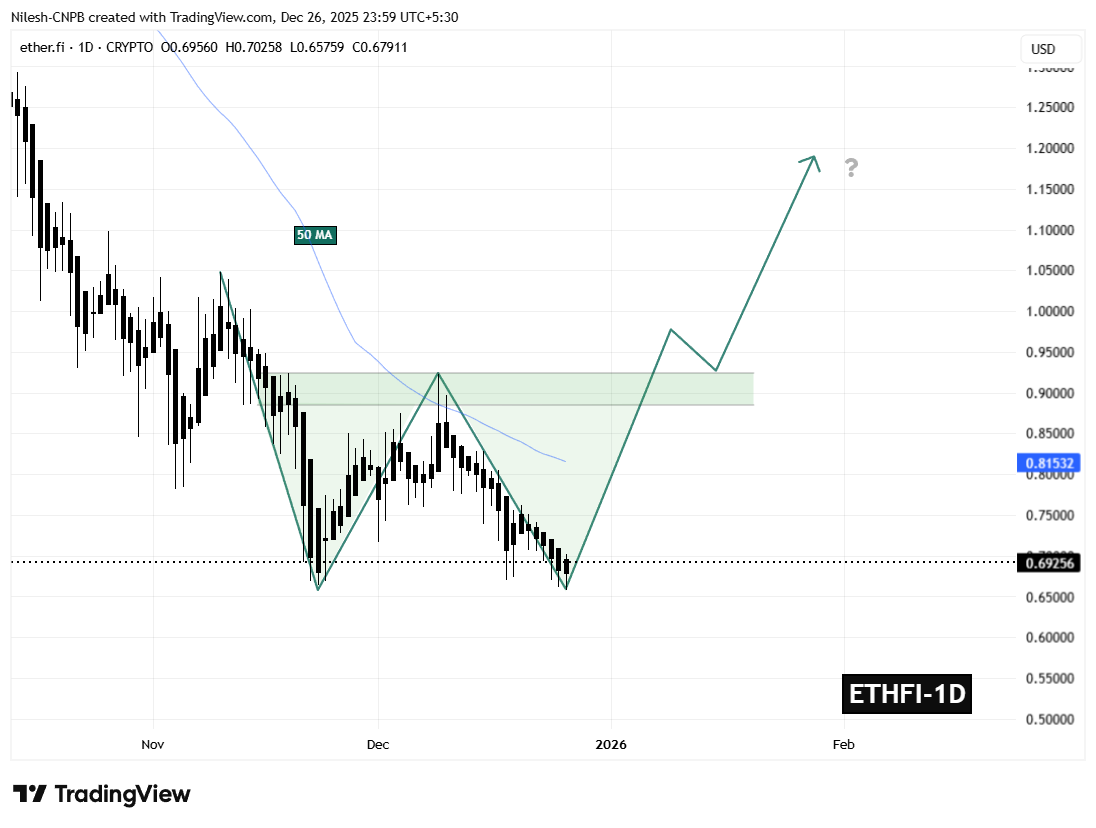
ETHFI Daily Chart/Coinsprobe (Source: Tradingview)
If this support continues to hold, the ongoing consolidation could mark the completion of the second bottom — a critical step in shifting momentum away from sellers and toward a potential trend reversal.
What’s Next for ETHFI?
The $0.65 support zone remains the most important level to monitor in the near term. As long as ETHFI holds above this area, the developing bullish structure remains valid and provides room for momentum to gradually rebuild.
On the upside, the first major challenge sits at the 50-day moving average near $0.8153. This level has repeatedly capped recovery attempts throughout the recent downtrend and now represents the initial test for buyers. A sustained move above this moving average would signal improving market structure and growing bullish confidence.
Beyond that, the $0.9233 neckline stands as the key confirmation level. A decisive breakout above this resistance would complete the double-bottom pattern and significantly strengthen the bullish outlook, potentially opening the door for a broader recovery move in the weeks ahead.
For now, ETHFI finds itself at a technically pivotal zone — one that could either reinforce the existing downtrend or mark the beginning of a meaningful rebound if buyers continue to defend support.
Disclaimer: The views and analysis presented in this article are for informational purposes only and reflect the author’s perspective, not financial advice. Technical patterns and indicators discussed are subject to market volatility and may or may not yield the anticipated results. Investors are advised to exercise caution, conduct independent research, and make decisions aligned with their individual risk tolerance.
Disclaimer: The information on this page may come from third parties and does not represent the views or opinions of Gate. The content displayed on this page is for reference only and does not constitute any financial, investment, or legal advice. Gate does not guarantee the accuracy or completeness of the information and shall not be liable for any losses arising from the use of this information. Virtual asset investments carry high risks and are subject to significant price volatility. You may lose all of your invested principal. Please fully understand the relevant risks and make prudent decisions based on your own financial situation and risk tolerance. For details, please refer to
Disclaimer.
Articoli correlati
Bitcoin holds ground as gold, silver slide on ETF outflows and liquidity strains: JPMorgan
Bitcoin BTC$68,953.10 is proving more resilient than traditional safe-haven assets as gold and silver come under pressure from outflows, positioning unwinds and deteriorating liquidity, according to Wall Street investment bank JPMorgan.
"The deterioration in liquidity conditions in gold has seen it
CoinDesk3m fa
摩根大通:黄金白银承压之际,比特币展现出更强韧性
摩根大通的报告指出,比特币在黄金和白银流动性恶化及资金流出情况下展现出更强韧性。黄金月内跌幅约15%,流动性指标降于比特币,资金流向和仓位数据也显示出明显分化,比特币ETF持续净流入。
BlockBeatNews4m fa
BTC Trades At $69,612 As Fidelity Investments Makes Massive $83 Million Bitcoin Purchase, Fueling...
Fidelity Investments' recent purchase of $83 million in Bitcoin highlights growing institutional confidence in the cryptocurrency. This move comes amid Bitcoin's consolidation phase, indicating strong demand and resilience despite market challenges.
BlockChainReporter21m fa
Greeks.live:明日加密期权将迎季度交割,整体情绪依然偏空
Greeks.live发布消息称,明天将迎来今年第一季度最大期权交割,近40%期权到期。BTC最大痛点在75000美元,看跌期权交易量低,整体情绪偏空。IV Crush即将到来,短期期权买方处于劣势,机构则通过展期操作建仓未来看涨期权。
BlockBeatNews48m fa
CryptoQuant 分析師:比特幣長期持有者 SOPR 指標跌破 1,鑽石手正認賠殺出
CryptoQuant的分析師nino指出,比特幣長期持有者SOPR指標近期跌破1.0,顯示許多持幣超過155天的投資者正面臨虧損拋售,市場可能進入「投降」階段。這反映出即使是長期投資者也難以抵擋當前價格壓力,預示市場情勢的重大變化。
動區BlockTempo1h fa
The Definitive Stablecoin Landscape Series: North America
Stablecoins are undergoing an evolution into a foundational financial infrastructure. North America leads in development, focusing on regulated, compliant options. The market shows a shift with RLUSD gaining traction due to integration with Ripple, emphasizing real demand over exchange liquidity.
CoinDesk1h fa
