
Date: Sun, Dec 21 2025 | 08:56 AM GMT
The broader cryptocurrency market has remained under pressure over the past several weeks, following the sharp sell-off that began on October 10. That corrective phase dragged Ethereum (ETH) down by nearly 23% over the last 60 days and weighed heavily on overall market sentiment. While many altcoins have struggled to stabilize, Quant (QNT) has shown relative resilience, posting only a modest decline and holding above a historically important support zone.
From a technical perspective, the daily chart suggests that QNT may be approaching a critical decision point, with price action forming a recognizable structure that could influence its next directional move.
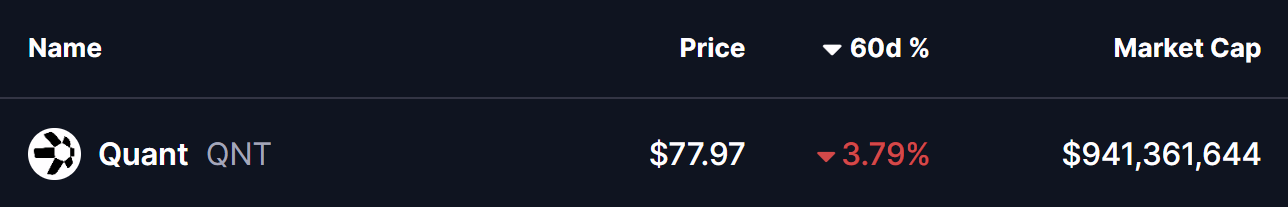
Source: Coinmarketcap
Head and Shoulders Pattern Takes Shape
On the daily timeframe, QNT appears to be carving out a head and shoulders formation, a well-known pattern that often signals a potential trend shift once the neckline is tested. Earlier in the structure, QNT formed the left shoulder before rallying sharply to its head near the $100 region. From there, price reversed lower and slid back toward the neckline, located around the $70 support zone.
This $70 area has proven to be a strong demand zone in the past, repeatedly attracting buyers and preventing deeper declines. The recent move into this region was met with a noticeable reaction, as reflected by the long lower wick on the chart. That rejection from support pushed price back toward the $78 level, suggesting that buyers are actively defending the neckline and potentially forming the right shoulder of the pattern.
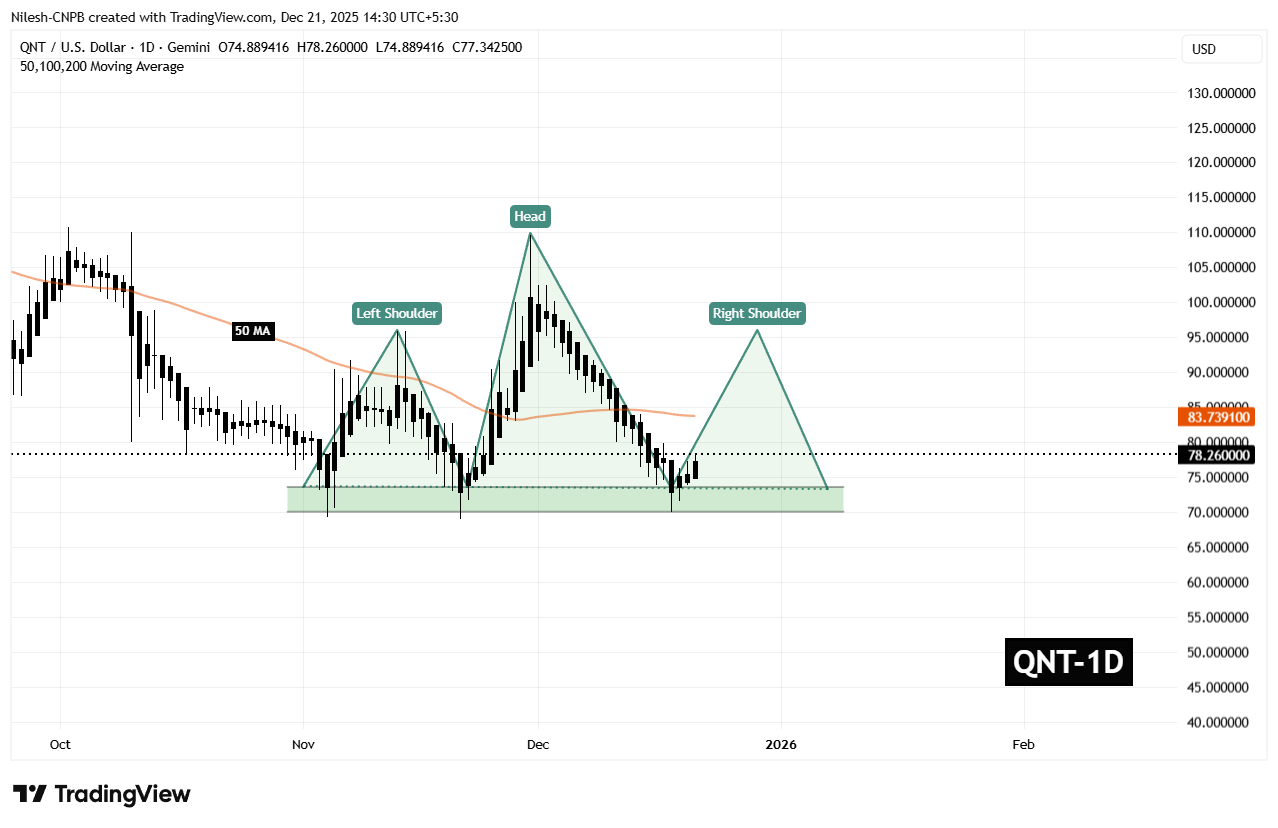
Quant (QNT) Daily Chart/Coinsprobe (Source: Tradingview)
The behavior around this zone is critical. A successful defense of the neckline often opens the door for a relief rally, especially if broader market conditions stabilize.
What’s Next for QNT?
For bullish momentum to build, QNT needs to reclaim the 50-day moving average, currently sitting near $83.73. This level now acts as a key short-term resistance, and a daily close above it would signal a shift in momentum back in favor of buyers.
If that recovery unfolds, the chart points toward a potential move into the $95.90 region. Such a move would represent a rebound of roughly 22% from current levels and align with the typical reaction seen during the right-shoulder phase of this pattern. A rally of this nature would not only ease recent selling pressure but also place QNT back into a more neutral technical posture.
That said, the setup remains delicate. If the $70 neckline support fails to hold on a sustained basis, the head and shoulders structure would remain bearish, opening the door to further downside and extending the corrective phase. For now, all eyes remain on how price behaves around this key support and whether buyers can regain control above the moving average.
Disclaimer: The views and analysis presented in this article are for informational purposes only and reflect the author’s perspective, not financial advice. Technical patterns and indicators discussed are subject to market volatility and may or may not yield the anticipated results. Investors are advised to exercise caution, conduct independent research, and make decisions aligned with their individual risk tolerance.
Disclaimer: The information on this page may come from third parties and does not represent the views or opinions of Gate. The content displayed on this page is for reference only and does not constitute any financial, investment, or legal advice. Gate does not guarantee the accuracy or completeness of the information and shall not be liable for any losses arising from the use of this information. Virtual asset investments carry high risks and are subject to significant price volatility. You may lose all of your invested principal. Please fully understand the relevant risks and make prudent decisions based on your own financial situation and risk tolerance. For details, please refer to
Disclaimer.
Articoli correlati
Bitcoin (BTC) Stuck in a ‘No Trade Zone:’ When Is the Next Big Move Coming?
The primary cryptocurrency has experienced significant volatility lately, mainly due to the geopolitical tension caused by the war in the Middle East.
One popular analyst described the current price area as a “no-trade zone,” arguing that a clear move in either direction will depend on how BTC
CryptoPotato2m fa
比特幣今日為何上漲?川普暫停伊朗能源設施打擊,聯準會表態提振風險市場
比特幣在3月31日回升至67,000美元以上,主要受美伊外交訊號及聯準會維持利率不變的影響。市場情緒暫時升溫,但伊朗外交部強調未進行直接談判可能限制反彈。霍爾木茲通行費法案潛在影響供應鏈,推高油價並對市場構成壓力,需密切關注後市走勢。
MarketWhisper3m fa
今日加密货币恐慌贪婪指数升至 11,市场处于极度恐慌状态
Gate News 消息,3 月 31 日,据 Alternative.me 数据,今日加密货币恐慌与贪婪指数升至 11,市场处于极度恐慌状态。昨日该指数为 8,同样处于极度恐慌状态。
GateNews24m fa
Why Higher XRP Prices Make Payments Cheaper, Ripple’s Schwartz Clarifies Misconception
A key misunderstanding around XRP is being clarified in a way that reframes its upside, showing that higher prices can enhance payment efficiency, strengthen liquidity dynamics, and position the asset more competitively for large-scale global transactions.
XRP Price Efficiency Liquidity
Coinpedia33m fa
Bitcoin’s Most Dangerous Pattern Just Triggered: Will BTC Dump to $26K Next?
Although bitcoin has already dumped by over 50% from its all-time high of over $126,000 marked in October to a multi-year low of $60,000, the asset’s troubles might not be over, warned Merlijn The Trader.
The popular analyst indicated that the “most dangerous bitcoin pattern just completed phase
CryptoPotato1h fa
Bittensor (TAO) Hits a 3-Month Peak: What Caused the Rally and What Comes Next?
Many leading cryptocurrencies have posted slight declines or negligible increases over the past 24 hours, but this isn’t the case for Bittensor (TAO), whose price soared by 15%.
The question now is whether this momentum can hold or if a pullback is coming next.
Further Gains
CryptoPotato2h fa
