Date: Sat, Dec 20 2025 | 10:55 AM GMT
The broader cryptocurrency market has remained locked in choppy price action over the past several weeks, a phase that began after the sharp sell-off on October 10. That correction pulled Ethereum (ETH) lower by nearly 23% over the last 60 days, keeping consistent downside pressure on major altcoins. **Arbitrum (ARB) **has been caught in the same wave of weakness, struggling to regain bullish momentum.
ARB has fallen by more than 38% over the past two months. While the short-term trend still points lower, the higher-timeframe chart is starting to reveal a structure that often appears near market turning points. If key levels are reclaimed, this setup could open the door for a meaningful recovery.
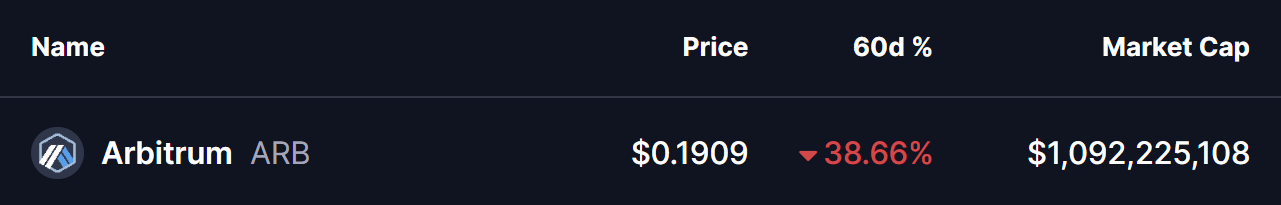
Source: Coinmarketcap
Power of 3 Pattern in Focus
On the higher-timeframe chart, ARB appears to be developing a classic Power of 3 formation, a pattern commonly linked to market cycle lows and trend transitions. This structure typically unfolds in three phases: accumulation, manipulation, and expansion, with the strongest directional move often emerging once the final phase begins.
Earlier, ARB spent an extended period moving sideways within a clearly defined range between $0.2250 and $0.1914. This low-volatility environment, highlighted by the grey box on the chart, represents the accumulation phase. During such phases, selling pressure eases and longer-term participants often begin positioning quietly while broader market sentiment remains cautious.
That calm structure eventually broke down as the broader market weakened. ARB slipped decisively below the $0.1914 support and dropped to a local low near $0.1721 before staging a modest rebound. This sharp move lower aligns closely with the manipulation phase of the Power of 3 pattern. Such breakdowns are frequently designed to trigger stop-losses and force capitulation, flushing out weaker hands before price attempts to stabilize.
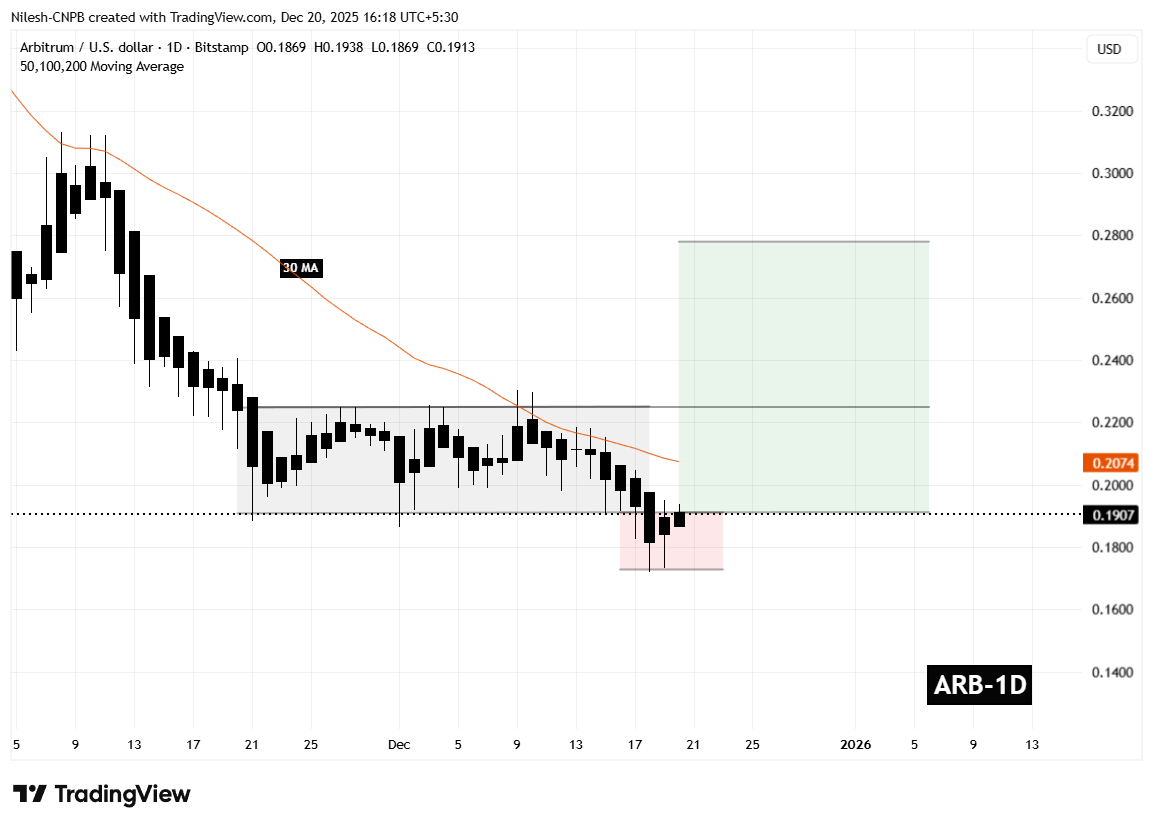
Arbitrum (ARB) Daily Chart/Coinsprobe (Source: Tradingview)
Notably, selling pressure has begun to cool around this lower zone. Recent candles show reduced downside follow-through, suggesting that bearish momentum may be losing strength as price probes for a base.
What’s Next for ARB?
At the time of writing, ARB is trading just below the lower boundary of its former range, near $0.1907. Price also remains below the 30-period moving average around $0.2074, which is currently acting as a key short-term resistance. This keeps the broader setup in a wait-and-see phase.
For the bullish case to gain traction, ARB needs to reclaim both the $0.1914 level and push back above the moving average. A sustained recovery above these levels would signal that the manipulation phase has likely ended and that the expansion phase of the Power of 3 structure may be getting underway.
If buyers manage to break and hold above the $0.2250 resistance, the chart projection points toward a potential move into the $0.2779 region. This level aligns with prior structural resistance and represents an upside of roughly 45% from current prices.
However, this setup remains conditional. As long as ARB continues to trade below the $0.2074 resistance, downside risks cannot be ruled out, and the market remains vulnerable to further volatility. Holding recent lows and reclaiming key resistance levels will be critical for bulls looking to validate a bullish reversal narrative.
Disclaimer: The views and analysis presented in this article are for informational purposes only and reflect the author’s perspective, not financial advice. Technical patterns and indicators discussed are subject to market volatility and may or may not yield the anticipated results. Investors are advised to exercise caution, conduct independent research, and make decisions aligned with their individual risk tolerance.
Disclaimer: The information on this page may come from third parties and does not represent the views or opinions of Gate. The content displayed on this page is for reference only and does not constitute any financial, investment, or legal advice. Gate does not guarantee the accuracy or completeness of the information and shall not be liable for any losses arising from the use of this information. Virtual asset investments carry high risks and are subject to significant price volatility. You may lose all of your invested principal. Please fully understand the relevant risks and make prudent decisions based on your own financial situation and risk tolerance. For details, please refer to
Disclaimer.
