#BitcoinPlungeNearsHistoricLows
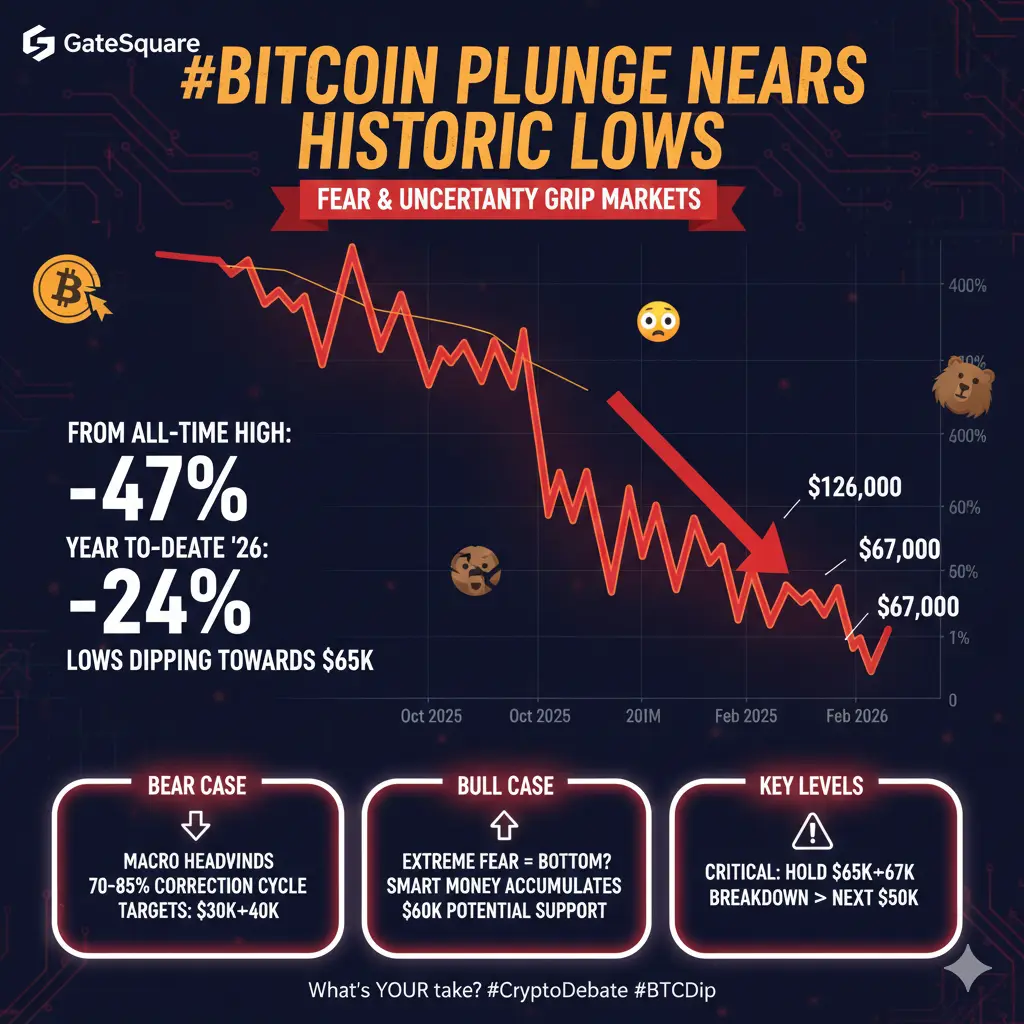
The #BitcoinPlungeNearsHistoricLows topic is blowing up right now in mid-February 2026, and it's a wild mix of fear, analysis, and debate across crypto communities. Bitcoin has taken a serious hit, dropping sharply from its all-time high above $126,000 in October 2025 to the current range around $66,000–$68,000 (hovering near $67,000 as of recent sessions, with lows dipping toward $65,000–$66,000). This represents a roughly 45–50% drawdown from the peak, sparking talks of whether we're nearing "historic lows" like the $15,000–$20,000 levels from the 2022 bear market.
Here's a full breakdown of the key points driving this discussion:
The Brutal Price Action So Far
Bitcoin peaked over $126K in late 2025 amid hype around institutional adoption, ETFs, and macro optimism.
Since then, it's plunged hard—down over 25% in the past month alone, with multiple red weeks stacking up (potentially the longest losing streak since 2018 if February closes lower).
Year-to-date 2026 performance is ugly: down about 24%, marking one of the worst Q1 starts in years.
Recent sessions show consolidation in a tight range ($65K–$72K), but bounces keep failing, and downside pressure returns quickly (e.g., dipping below $67K amid Fed minutes hints at possible rate hikes).
Why This Plunge Feels So Intense
Macro Pressures — Higher-for-longer interest rates, recession signals, liquidity squeezes, and deleveraging across risk assets are crushing sentiment. Bitcoin isn't acting like "digital gold" right now—it's behaving more like a high-beta risk asset tied to stocks.
Post-ATH Correction — After massive 2025 gains, profit-taking, over-leveraged positions getting wiped, and reduced ETF inflows (no full "crypto winter" panic yet, but flows are down).
Four-Year Cycle Theory — Many analysts point to Bitcoin's historical pattern: massive bull runs post-halving, followed by brutal 70–85% corrections. This drop fits the early-to-mid bear phase seen in past cycles (2018, 2022). Bears argue we could see 75–85% total drawdown from ATH, targeting $30K–$40K or even lower.
Sentiment Extremes — Fear is high, retail selling off while some big players accumulate quietly. No major catalyst (like FTX collapse) this time—just grinding macro pain and exhaustion.
Are We Really Nearing Historic Lows?
Not yet in absolute terms—$66K–$67K is still way above 2022's $15K–$20K bottom or earlier cycles' lows.
But relatively, yes: It's testing the lower end of the multi-year range, multi-month lows (since late 2024/early 2025), and key support zones ($60K–$65K). If those break, $50K–$52K becomes the next popular target for bears.
Bulls counter: This could be the cycle bottom forming now (some like Tom Lee or K33 see $60K as potential support, with consolidation ahead rather than total collapse). Hodlers from early 2024 are holding firm, no mass capitulation yet.
What Traders and Analysts Are Saying
Bears: Macro deterioration + history suggest more pain ahead—possible retest of lower levels if no Fed pivot or risk-on recovery.
Bulls/Opportunists: Extreme fear often marks bottoms; smart money accumulates here. Expect slow, discouraging consolidation before any real reversal.
Neutral: Bitcoin is in a pivotal spot—holding $65K–$67K range could stabilize things, but a break lower accelerates the slip
This plunge tests everyone's conviction. For long-term believers, it's a classic crypto gut-check: volatility is the price of entry. Short-term, it's rough—many feeling the pain of leveraged positions or FOMO buys at higher levels. But cycles have always delivered recoveries after these phases.