ALEXKHAN

vip
Age 1.5 Yıl
Peak Tier 0
No content yet
#CryptoMarketSeesVolatility
🚨 Crypto Market Enters High Volatility Phase Amid Iran Geopolitical Crisis, Institutional Liquidity Flow, and Structural Market Compression
The global cryptocurrency market is currently experiencing a sustained high-volatility environment, where price action is being influenced by a combination of geopolitical instability, macroeconomic risk repricing, derivatives positioning, and institutional accumulation patterns, creating a complex market structure in which short-term movements appear highly reactive while the underlying long-term trend remains dependent on li
HighAmbition
#CryptoMarketSeesVolatility
🚨 Crypto Market Enters High Volatility Phase Amid Iran Geopolitical Crisis, Institutional Liquidity Flow, and Structural Market Compression
The global cryptocurrency market is currently experiencing a sustained high-volatility environment, where price action is being influenced by a combination of geopolitical instability, macroeconomic risk repricing, derivatives positioning, and institutional accumulation patterns, creating a complex market structure in which short-term movements appear highly reactive while the underlying long-term trend remains dependent on liquidity absorption and macro resolution.
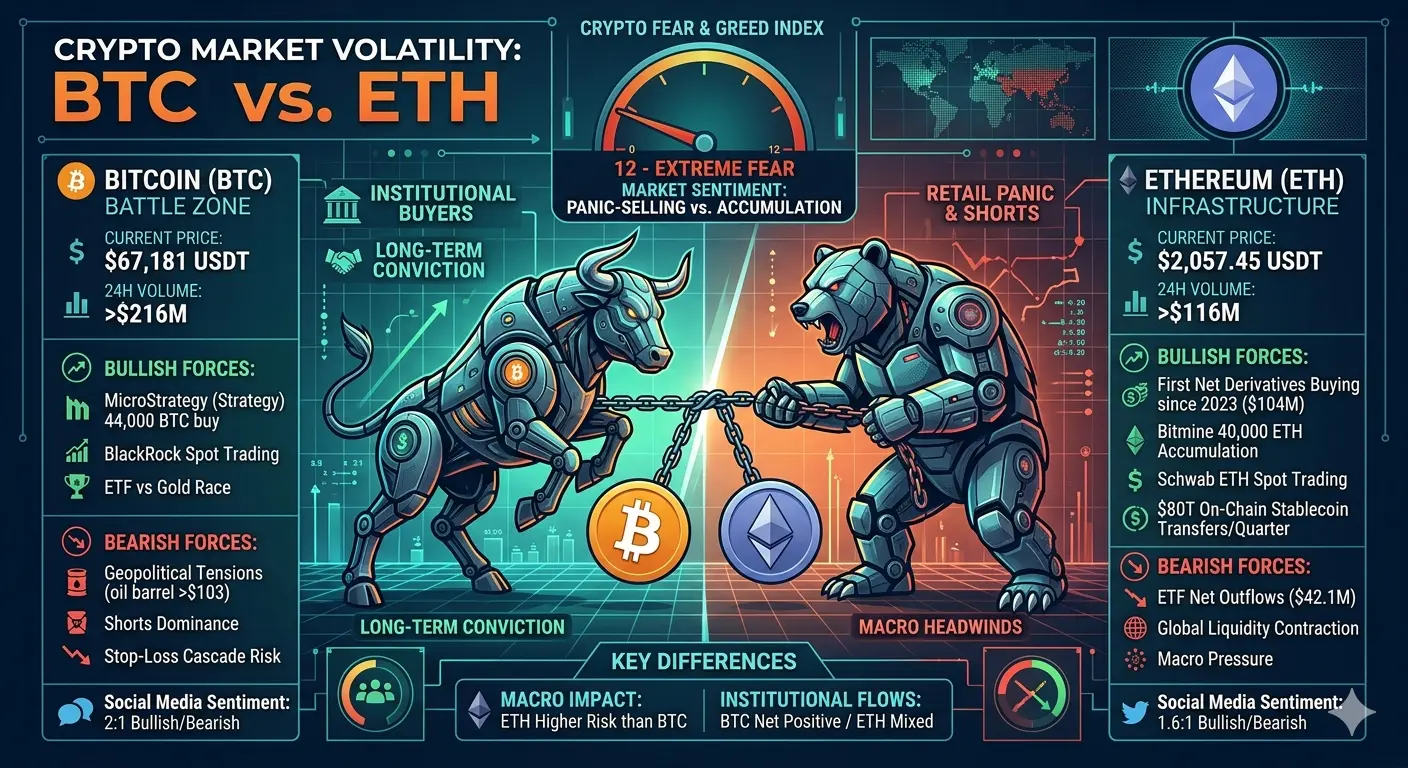
At present, Bitcoin is trading around $77,700, while Ethereum is trading near $2,300–$2,320, and both assets are showing completely different short-term behavior patterns despite sharing the same macro environment, which clearly indicates that market dynamics are being driven more by asset-specific liquidity conditions and positioning structures rather than uniform directional sentiment across the entire crypto sector.
📊 Current Market Structure and Price Behavior Analysis
Bitcoin continues to trade in a relatively tight but volatile range between $76,900 and $78,600, where price repeatedly tests both support and resistance levels without establishing a sustained breakout direction, suggesting that the market is currently in a liquidity compression phase, where both buyers and sellers are actively defending key levels while larger institutional participants gradually absorb supply in the background.
Ethereum, on the other hand, is showing slightly weaker short-term momentum as it fluctuates within the range of $2,285 to $2,358, reflecting mild downside pressure of approximately -1% in the last 24 hours, however this movement does not represent structural breakdown but rather short-term repositioning within a broader accumulation structure where staking activity and long-term holding behavior continue to provide underlying price stability.
The overall market condition can therefore be described as sideways consolidation with high intraday volatility spikes, where price remains range-bound but reacts sharply to external macro triggers, which is a typical characteristic of markets transitioning between uncertainty-driven contraction and liquidity-driven expansion phases.
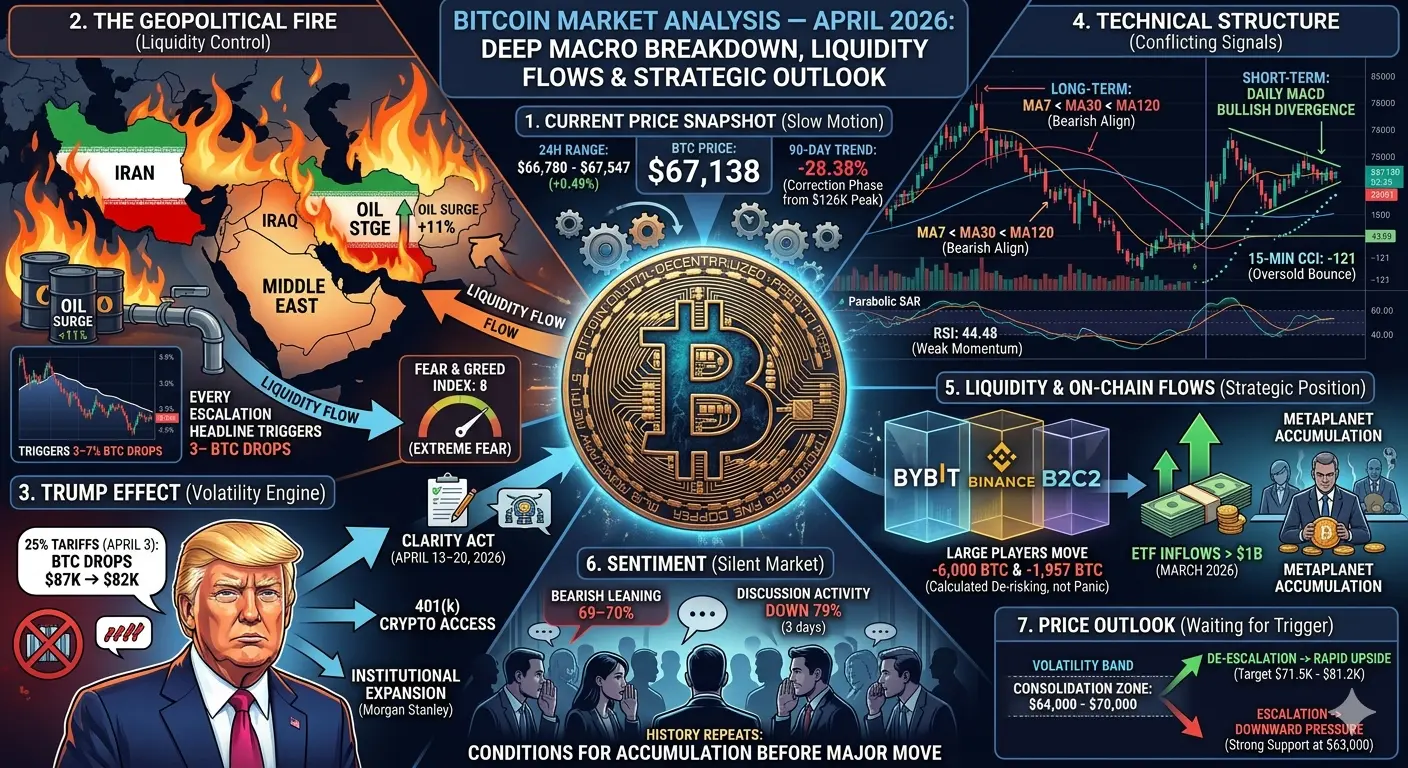
🌍 Geopolitical Shock: Iran–US Tension as Primary Macro Catalyst
The dominant driver behind current market volatility remains the escalating geopolitical tension between the United States and Iran, particularly following the breakdown of nuclear negotiations and increasing instability in the Strait of Hormuz, which plays a critical role in global oil transportation and energy supply chains, and any disruption in this region has historically resulted in immediate risk repricing across global financial markets including equities, commodities, and digital assets.
This situation has created a global risk-off sentiment environment, where capital temporarily shifts away from high-volatility assets such as cryptocurrencies and moves toward safer instruments, while at the same time increasing volatility due to rapid repositioning of leveraged positions, derivatives exposure adjustments, and liquidity redistribution across exchanges.
As a result, crypto markets are not reacting in isolation but are instead behaving as part of a broader macro liquidity system where geopolitical uncertainty directly influences risk appetite and capital allocation behavior.
🧠 Market Sentiment: Fear Zone but Early Accumulation Behavior Emerging
The Fear and Greed Index currently sitting at 39 (Fear Zone) indicates that market sentiment is cautious and uncertain, however historically such levels have often coincided with early accumulation phases rather than deep capitulation events, especially when supported by strong institutional inflows and declining exchange reserves.
This creates a critical divergence between retail sentiment and institutional behavior, where retail participants are primarily reacting to uncertainty by reducing exposure, while institutional investors are gradually increasing exposure during volatility, thereby creating a silent transfer of assets from weaker hands to stronger hands.
🏦 Institutional Activity: Silent but Strong Accumulation Trend
Despite short-term price fluctuations, institutional accumulation continues to remain one of the strongest underlying forces in the current market structure, as large Bitcoin wallets have accumulated approximately 270,000 BTC over the past 30 days, while exchange reserves continue to decline to multi-year lows, indicating that available liquid supply is steadily decreasing.
Additionally, spot Bitcoin ETFs have maintained consistent inflows, reflecting sustained institutional interest, and suggesting that large capital allocators are treating current volatility as an accumulation opportunity rather than a distribution phase.
This behavior strongly indicates that while price remains range-bound, structural demand is quietly increasing beneath the surface, which is a historically significant precursor to long-term bullish expansion phases.
🔵 Ethereum Market Dynamics: Mixed Short-Term Pressure but Strong Structural Foundation
Ethereum is currently displaying a mixed market structure where short-term price weakness coexists with strong underlying fundamental strength, as evidenced by increasing staking participation levels reaching approximately 32% of total supply, continued growth in network activity exceeding 200 million transactions in Q1 2026, and sustained institutional accumulation trends that suggest long-term confidence in Ethereum’s ecosystem remains intact.
However, in the short term, Ethereum is facing resistance in the $2,350–$2,400 range, while maintaining key support around $2,200–$2,250, which creates a defined trading structure where price is likely to remain range-bound until a broader macro or liquidity-driven catalyst triggers a breakout in either direction.
⚡ Why Volatility Remains Elevated Across Crypto Markets
The current high-volatility environment is not the result of a single factor but rather a combination of multiple overlapping structural forces, including geopolitical uncertainty increasing global risk premiums, derivatives market imbalances creating leveraged position unwinding, funding rate fluctuations indicating mixed long and short positioning, and technical compression across Bitcoin and Ethereum that builds energy for eventual breakout movements.
Additionally, the presence of both negative and neutral funding rates suggests that short positioning remains structurally active, which increases the probability of short squeeze scenarios if upward momentum begins to build unexpectedly, thereby amplifying volatility in both directions.
📉 Market Psychology: A Silent Battle Between Fear and Accumulation
The current market psychology reflects a clear divergence between retail and institutional behavior, where retail traders remain cautious due to geopolitical uncertainty and short-term price instability, while institutional participants continue to accumulate strategically during volatility phases, creating a silent but powerful redistribution cycle within the market structure.
This environment is typically characterized by low conviction breakouts, frequent fake moves, and sharp liquidity-driven reversals, all of which serve to eliminate weak leveraged positions before a more sustainable trend direction emerges.
📊 Trading Structure and Liquidity-Based Market View
From a structural perspective, the market can currently be divided into three phases: the first phase being fear-driven volatility expansion where uncertainty dominates price action, the second phase being the current accumulation zone where price remains range-bound while liquidity is absorbed, and the third phase being the eventual expansion phase where breakout momentum develops once liquidity imbalance reaches a critical threshold.
Bitcoin’s current trading behavior between $76,900 and $78,600, combined with Ethereum’s range between $2,285 and $2,358, strongly supports the interpretation that the market is in a controlled compression phase rather than a directional breakdown or full bullish breakout phase.
🔮 Forward-Looking Market Outlook
Looking ahead, the direction of the cryptocurrency market will remain heavily dependent on geopolitical developments related to Iran–US negotiations, global energy stability, and broader macroeconomic liquidity conditions, while simultaneously being supported by structural tailwinds such as continued Bitcoin ETF inflows, declining exchange reserves, and post-halving supply dynamics that historically contribute to long-term bullish cycles.
If geopolitical tensions begin to stabilize, the market is likely to transition into a strong liquidity-driven expansion phase where Bitcoin could break above $80,000, Ethereum could move toward $2,600+, and altcoins could follow with delayed but amplified momentum, whereas continued escalation may result in prolonged sideways volatility with periodic downside liquidity tests before structural recovery resumes.
🚀 Final Conclusion
The current cryptocurrency market should not be interpreted as a simple bullish or bearish environment, but rather as a liquidity-driven equilibrium phase under macro uncertainty, where price is temporarily compressed while institutional capital continues to accumulate beneath the surface, and where volatility is not a sign of weakness but rather a reflection of active capital redistribution within a structurally evolving financial system.
Ultimately, the key takeaway is that in crypto markets, fear does not destroy value but instead redistributes it, and the current phase represents a critical accumulation window where smart capital positions itself before the next major directional expansion begins.
💡 Key Insight
In modern crypto markets, price is only the visible layer, while liquidity flow, institutional positioning, and macro uncertainty determine the real direction, and the current environment clearly shows that while volatility is high, structural accumulation is even stronger beneath the surface.
repost-content-media
  • Reward
  • Comment
  • Repost
  • Share
#rsETHAttackUpdate :
The rsETH Attack: A $292M DeFi Shock That Redefined Crypto Security in 2026
The crypto market was violently shaken on April 18, 2026, when KelpDAO’s rsETH ecosystem suffered a devastating exploit worth approximately $292 million. This was not just another DeFi hack—it became a systemic stress test for the entire decentralized finance ecosystem, exposing structural weaknesses in cross-chain infrastructure, collateral design, and protocol interdependence.
What followed was not only a token collapse—but a liquidity shock, confidence crisis, and a forced global reassessment o
ETH-0,63%
AAVE0,9%
ARB-0,2%
HighAmbition
#rsETHAttackUpdate :
The rsETH Attack: A $292M DeFi Shock That Redefined Crypto Security in 2026
The crypto market was violently shaken on April 18, 2026, when KelpDAO’s rsETH ecosystem suffered a devastating exploit worth approximately $292 million. This was not just another DeFi hack—it became a systemic stress test for the entire decentralized finance ecosystem, exposing structural weaknesses in cross-chain infrastructure, collateral design, and protocol interdependence.
What followed was not only a token collapse—but a liquidity shock, confidence crisis, and a forced global reassessment of DeFi risk models.
🧠 Understanding rsETH and Its Role in DeFi
rsETH is a liquid restaking token issued by KelpDAO, allowing users to stake Ethereum while keeping liquidity active across DeFi platforms.
In simple terms:
Users stake ETH → receive rsETH
rsETH is used in lending, borrowing, and yield strategies
It acts as collateral across multiple DeFi ecosystems
This makes rsETH a systemically important asset in DeFi, meaning any instability affects not just one protocol—but many interconnected markets.
⚠️ How the $292M Exploit Happened
The attack exploited a critical flaw in KelpDAO’s cross-chain verification system, specifically within a LayerZero bridge adapter.
🔴 Core vulnerability:
KelpDAO used a single-verifier DVN (Decentralized Verifier Network) configuration.
Instead of requiring multiple independent confirmations, only one verifier approval was needed to validate cross-chain messages.
That single point of trust became the entry point for attackers.
🧨 Attack Execution Flow
The exploit unfolded in a highly structured sequence:
1. Fake Cross-Chain Messages
Attackers injected forged messages into the system, pretending legitimate deposits occurred across chains.
2. Minting Unbacked rsETH
The system incorrectly minted:
~116,500 rsETH tokens
Worth approximately $292 million
With no real ETH backing
3. DeFi Collateral Abuse
The attackers used rsETH as collateral on major lending protocols (including Aave) and borrowed real assets:
~52,834 WETH (Ethereum mainnet)
~29,782 WETH + 821 wstETH (Arbitrum)
4. Extraction of Real Liquidity
This created a massive imbalance between synthetic collateral and real assets, leading to systemic exposure.
📉 Immediate Market Reaction
The impact was instant:
rsETH sharply depegged from ETH
Ethereum experienced short-term pressure
DeFi tokens (especially lending protocols) dropped significantly
Trading volumes surged due to panic repositioning
Ethereum Price Context (Current Market)
At the time of market stabilization:
ETH Price: ~$2,320–$2,380 range
Market remained in a consolidation phase between $2,100–$2,400 zones
Despite the exploit, ETH remained structurally stable because the issue was not Ethereum itself—but a layered DeFi dependency failure.
💣 Systemic Impact: The DeFi Liquidity Shock
The most dangerous outcome was not the hack itself—but the liquidity chain reaction.
Key consequences:
Massive withdrawals from DeFi lending protocols
Sudden liquidity contraction across multiple chains
Collateral reassessment across lending platforms
Risk repricing across all synthetic assets
This resembled a “digital bank-run effect”, where fear spreads faster than technical fixes.
Aave and other lending platforms faced:
Rising bad debt exposure
Emergency asset freezes
Collateral re-evaluation processes
🛡️ Emergency Protocol Responses
🔹 KelpDAO Actions:
Paused rsETH minting and transfers
Suspended cross-chain operations
Began full reserve reconciliation
🔹 Aave Actions:
Froze rsETH collateral markets
Removed borrowing power from rsETH
Initiated risk containment procedures
🔹 Ecosystem Response:
Major DeFi players created emergency liquidity support pools to stabilize rsETH backing and reduce systemic damage.
📊 Ethereum Trading Strategy (Post-Exploit Market Structure)
Despite the chaos, ETH continues to trade within a structured macro range.
🟢 Current ETH Market Zone:
Range: $2,200 – $2,450
Bias: Neutral to slightly bearish consolidation
Volatility: Moderate, event-driven spikes
📈 ETH Trading Strategy (Simplified Institutional Approach)
1. Accumulation Zone Strategy
Range: $2,100 – $2,250
Considered long-term value accumulation zone
Suitable for gradual spot entry
Ideal for DCA (Dollar Cost Averaging)
2. Breakout Strategy
Trigger: Above $2,450
Confirms bullish expansion phase
Targets: $2,600 → $2,800
Momentum continuation likely if volume supports
3. Risk/Downside Strategy
If breakdown below $2,100:
Market enters deeper correction phase
Next support: $1,950–$2,000
Defensive positioning recommended
⚖️ Market Sentiment Shift After rsETH Attack
The event has permanently shifted market psychology:
Before:
High trust in cross-chain composability
Aggressive leverage usage
Strong confidence in synthetic collateral systems
After:
Increased skepticism toward bridged assets
Lower leverage appetite
Strong preference for native collateral (ETH, BTC)
Higher demand for protocol insurance models
🔍 Key Lessons for Crypto Investors
1. Composability is powerful—but fragile
One weak link can destabilize entire systems.
2. Cross-chain bridges remain high-risk infrastructure
Even advanced protocols can fail if verification is centralized.
3. Collateral ≠ safety
Synthetic assets require deeper risk analysis than native assets.
4. DeFi is now entering “risk maturity phase”
Security will matter more than speed or innovation.
📌 Final Outlook
The rsETH exploit is more than a hack—it is a defining moment for DeFi evolution.
While the immediate damage was severe, the long-term outcome may actually strengthen the ecosystem through:
Better bridge security standards
Improved collateral frameworks
Stronger risk management systems
More realistic leverage controls
Ethereum and DeFi markets have survived this shock—but the rules of the game are changing.
🚀 Closing Insight
In crypto, innovation always moves faster than regulation or security. The rsETH incident is a reminder that:
The future of DeFi will not be defined by how fast it grows—but by how well it survives its own complexity.
repost-content-media
  • Reward
  • Comment
  • Repost
  • Share
#IntelandTexasInstrumentsSurge
Intel and Texas Instruments Surge: Comprehensive Analysis and Crypto Market Impact
The semiconductor sector witnessed a historic rally in late April 2026, with both Intel and Texas Instruments posting their most significant single-day gains in over two decades. This surge represents a pivotal moment in the chip industry, signaling a fundamental shift from narrow AI-driven growth to a broader semiconductor upcycle that has far-reaching implications for the technology ecosystem, including the cryptocurrency market.
The Magnitude of the Surge
Texas Instruments expe
HighAmbition
#IntelandTexasInstrumentsSurge
Intel and Texas Instruments Surge: Comprehensive Analysis and Crypto Market Impact
The semiconductor sector witnessed a historic rally in late April 2026, with both Intel and Texas Instruments posting their most significant single-day gains in over two decades. This surge represents a pivotal moment in the chip industry, signaling a fundamental shift from narrow AI-driven growth to a broader semiconductor upcycle that has far-reaching implications for the technology ecosystem, including the cryptocurrency market.
The Magnitude of the Surge
Texas Instruments experienced an extraordinary 18 to 19 percent surge on April 23, 2026, marking its best single-day performance since the year 2000 or 2001. This remarkable rally was triggered by the company's first-quarter earnings report, which delivered results that significantly exceeded Wall Street expectations. The company reported earnings per share of 1.68 dollars, crushing the consensus estimate of 1.36 dollars. Revenue growth reached 19 percent, totaling 4.83 billion dollars compared to the analyst estimate of 4.53 billion dollars. Looking ahead, Texas Instruments provided upbeat second-quarter guidance, projecting revenue between 5 billion and 5.4 billion dollars, representing 17 percent growth at the midpoint.
Intel's performance was equally impressive, with the stock surging approximately 20 percent in extended trading following its earnings announcement. This gain positioned Intel to potentially achieve its best post-earnings performance on record. The stock surpassed its August 2000 highs, approaching levels last seen during the dot-com era. Intel's earnings beat was substantial, with revenue exceeding estimates by over 1 billion dollars, second-quarter guidance beating by 2 billion dollars, and earnings per share crushing expectations by an astounding 2800 percent. Gross margins also exceeded forecasts by 3 percentage points.
Key Drivers Behind the Rally
The primary catalyst for both companies' surge was the explosive growth in artificial intelligence infrastructure and data center demand. Texas Instruments benefited from a 90 percent year-over-year increase in data center revenue, driven by hyperscalers requiring power management, analog signal chain, and embedded processing chips for their AI operations. The company's analog chips are crucial components in the AI data center buildout, providing essential power management and signal processing capabilities.
Intel's rally reflected robust CPU demand amid the AI and data center expansion. The company announced significant partnerships, including Tesla's commitment to build chip factories in Texas using Intel's advanced 14A process technology. This partnership with Tesla and potential collaboration with SpaceX has bolstered investor confidence in Intel's manufacturing capabilities and future revenue streams.
The broader semiconductor ecosystem also benefited from this momentum. The Philadelphia Semiconductor Index achieved a record 16-day winning streak, with peer companies like AMD experiencing positive spillover effects. Analog and mixed-signal semiconductor companies including ON Semiconductor, Microchip Technology, and Analog Devices also saw their stocks bloom as the rally broadened across the sector.
Crypto Market Interconnection and Impact
While the Intel and Texas Instruments surge was primarily driven by AI and data center demand rather than cryptocurrency mining, the relationship between semiconductor performance and the crypto market operates through multiple interconnected channels.
The most direct connection lies in the mining infrastructure that underpins proof-of-work cryptocurrencies like Bitcoin. Although modern Bitcoin mining relies predominantly on specialized ASICs rather than general-purpose CPUs or analog chips, the semiconductor rally signals broader technology sector health that often correlates with risk asset performance, including cryptocurrencies. The current crypto market context shows Bitcoin trading around 77,490 USDT with a modest 0.26 percent gain over 24 hours, while Ethereum hovers near 2,307 USDT with a slight decline of 0.09 percent. The fear and greed index stands at 39, indicating a fearful market sentiment that contrasts with the exuberance in semiconductor stocks.
The divergence between semiconductor stocks and crypto prices suggests that the current chip rally is driven by fundamentally different factors than previous crypto-mining booms. During the 2017 and 2021 crypto bull runs, GPU manufacturers like Nvidia and AMD saw their stocks surge due to direct demand from cryptocurrency miners. The current Intel and Texas Instruments rally, however, stems from AI data center buildouts and industrial resurgence rather than crypto mining demand.
Indirect Effects on the Crypto Ecosystem
The semiconductor surge impacts the crypto market through several indirect mechanisms. First, the rally reflects strong institutional confidence in technology infrastructure, which often translates to increased risk appetite across digital assets. BlackRock, Strategy, and Morgan Stanley continue accumulating Bitcoin, with long-term holders adding over 300,000 BTC in the past 30 days. This institutional accumulation parallels the institutional investment driving semiconductor stocks higher.
Second, the data center expansion fueled by AI demand creates infrastructure that indirectly benefits cryptocurrency operations. Modern crypto mining facilities, exchanges, and blockchain nodes rely on robust data center infrastructure. Texas Instruments' power management chips and Intel's CPUs play supporting roles in the broader technology ecosystem that enables cryptocurrency operations, even if they are not the primary mining hardware.
Third, the semiconductor rally signals a normalization of inventory levels and the return of pricing power in the technology sector. Goldman Sachs highlighted an impending analog chip recovery, aligning with broader United States manufacturing reshoring efforts under the CHIPS Act. This policy support for domestic semiconductor manufacturing creates a more resilient supply chain for technology hardware, indirectly benefiting crypto infrastructure providers.
Sector Rotation and Capital Flow Implications
The historic surge in Intel and Texas Instruments may trigger sector rotation dynamics that affect cryptocurrency markets. When traditional technology stocks deliver exceptional returns, some capital may rotate from speculative assets like cryptocurrencies into established semiconductor names. However, the current market structure shows that crypto and semiconductor stocks can rise simultaneously, driven by different underlying factors.
The crypto market's current state reflects institutional accumulation and regulatory developments rather than retail speculation. United States Senator Lummis indicated that Bitcoin market structure legislation has gained bipartisan support, while Bitcoin Core privacy optimizations and application ecosystem expansion create new growth vectors. The Coinbase premium index has remained positive for 14 consecutive days, reflecting ample dollar liquidity and improving institutional sentiment.
Long-term Structural Implications
The Intel and Texas Instruments surge represents a structural shift from narrow AI growth concentrated in GPU manufacturers like Nvidia to a full-stack semiconductor upcycle. This broadening of the rally across analog, mixed-signal, and CPU segments suggests sustained industry strength that could extend through 2026 and beyond.
For the cryptocurrency market, this structural shift implies several developments. The expansion of data center capacity driven by AI demand creates excess infrastructure that could eventually be repurposed for blockchain operations or crypto mining during periods of high profitability. Texas Instruments' 60 billion dollar investment in new United States fabrication plants, where Apple will manufacture iPhone chips, represents a significant expansion of domestic semiconductor capacity that could indirectly support crypto hardware needs.
The industrial resurgence highlighted by Texas Instruments' aerospace and defense business, which generates over 1 billion dollars annually, alongside data center power strength, indicates broad-based economic recovery that typically supports risk assets including cryptocurrencies. As inventories normalize and pricing power returns to semiconductor manufacturers, the technology sector enters a more sustainable growth phase that benefits the entire digital asset ecosystem.
Conclusion
The Intel and Texas Instruments surge represents a watershed moment for the semiconductor industry, delivering the strongest performance in over two decades driven by AI infrastructure demand and industrial recovery. While the rally is not directly tied to cryptocurrency mining, the interconnected nature of technology markets creates multiple channels through which semiconductor strength influences the crypto ecosystem.
The current crypto market, with Bitcoin near 77,500 USDT and Ethereum around 2,300 USDT, operates in a different dynamic than the semiconductor rally, driven by institutional accumulation and regulatory developments rather than mining hardware demand. However, the broader technology sector health signaled by the chip surge, combined with supportive policy frameworks like the CHIPS Act and expanding data center infrastructure, creates a favorable environment for digital asset adoption and infrastructure development.
Investors should recognize that while Intel and Texas Instruments are not directly exposed to crypto mining demand, their performance reflects the same macroeconomic forces of technology adoption, infrastructure investment, and institutional risk appetite that drive cryptocurrency markets. The semiconductor upcycle's broadening from GPUs to analog chips and CPUs suggests a maturing technology market that ultimately supports the long-term viability of blockchain and cryptocurrency ecosystems.
repost-content-media
  • Reward
  • Comment
  • Repost
  • Share
#Gate13thAnniversaryLive
Gate Live 13th Anniversary Carnival: Celebrating 13 Years Together
Gate.io is celebrating its 13th anniversary with an extensive Live Carnival event running from April 20 to May 20, 2026. This milestone celebration marks Gate's journey since 2013, now serving over 50 million users worldwide. The event is structured around three main participant categories: new streamers, existing streamers, and viewers, each with tailored reward programs designed to maximize engagement across the platform's live streaming ecosystem.
New Streamer Incentives: Rising Star Program
The pla
HighAmbition
#Gate13thAnniversaryLive
Gate Live 13th Anniversary Carnival: Celebrating 13 Years Together
Gate.io is celebrating its 13th anniversary with an extensive Live Carnival event running from April 20 to May 20, 2026. This milestone celebration marks Gate's journey since 2013, now serving over 50 million users worldwide. The event is structured around three main participant categories: new streamers, existing streamers, and viewers, each with tailored reward programs designed to maximize engagement across the platform's live streaming ecosystem.
New Streamer Incentives: Rising Star Program
The platform has created substantial opportunities for first-time streamers through the Rising Star Program. Newcomers who complete 10 valid streams within 21 days, with each stream lasting at least 45 minutes, become eligible for rewards of up to 100 USDT worth of GT tokens. This requirement ensures that participants are genuinely committed to creating content rather than just registering for rewards. The 45-minute minimum per stream indicates Gate's focus on quality content that provides real value to viewers.
Beyond the completion rewards, there is a competitive element through the Rising Star Leaderboard. Streamers who broadcast at least 3 times within the first 7 days unlock the 13th Anniversary Traffic Pack, which includes one featured slot and two red packet boosts. This traffic support is crucial for new creators trying to build an audience. The top 5 streamers who complete the 10-stream requirement receive an Anniversary Gift Box plus a homepage feature. The ranking methodology considers stream count, average 30-second viewers, and follower growth, creating a balanced evaluation system that rewards both consistency and audience engagement.
Existing Streamer Rewards: Anniversary Glory Program
Gate has not forgotten its established content creators. The Comeback Reward specifically targets streamers who have been inactive for 15 days or more, offering them a VIP5 Trial Voucher limited to the first 100 participants. This strategy effectively re-engages dormant creators while maintaining exclusivity through the limited quantity.
The Popular Streamer Leaderboard operates across all active streamers with a sophisticated scoring system. The ranking criteria are weighted as follows: stream count contributes 30 percent, trading volume 20 percent, average 30-second viewers 20 percent, maximum streak days 20 percent, and anniversary-themed content 10 percent. This multi-dimensional approach ensures that rewards go to streamers who demonstrate both consistency and quality. The top-ranked streamer receives an Anniversary Gift Box, 200 USDT Position Voucher, and two homepage features. Positions 2 through 3 get an Anniversary Gift Box, 100 USDT Position Voucher, and one homepage feature. Ranks 4 to 6 receive an Anniversary Gift Box plus 50 USDT Position Voucher. Positions 7 to 10 get the Anniversary Gift Box only, while ranks 11 to 50 receive 50 USDT Position Vouchers. This tiered structure creates incentives at every level, encouraging broad participation rather than just competition for the top spot.
Viewer Rewards: Watch and Win
The viewer engagement strategy centers on two main mechanisms. Anniversary Red Packet Drops occur daily at random times plus every Friday at 21:00 UTC+8 across all Gate Live streams. This creates anticipation and encourages regular viewership. The check-in system rewards viewers who watch for at least 5 minutes, with a bonus 20 percent ranking boost for those who complete at least 3 trades. This clever integration ties viewership to platform trading activity, creating a symbiotic relationship between content consumption and trading behavior.
The check-in rewards escalate over time: completing 7 days of check-ins puts viewers in a draw where 100 users win 5 USDT Position Vouchers. Reaching 20 days of check-ins enters viewers into a draw for 5 Anniversary Gift Boxes. This progression rewards sustained engagement and creates multiple opportunities for viewers to benefit from their participation.
Anniversary Gift Box Contents
The Anniversary Gift Box represents a significant physical reward component of the celebration. While the exact contents are not fully detailed in the announcement, the gift boxes are shipped to winners and include commemorative merchandise celebrating Gate's 13th anniversary. The shipping process involves winners submitting their details through the Gate Shop, with delivery expected within 60 days. If merchandise is out of stock, equivalent value alternatives are provided, ensuring winners receive their rewards.
Position Vouchers and Trading Incentives
The Position Vouchers distributed throughout the event are Futures Position Vouchers valid for 7 days. These vouchers allow recipients to open futures positions without using their own capital, effectively giving them risk-free trading opportunities. For existing VIP5 users or above who might receive VIP5 Trial Vouchers, the reward converts to 10 USDT worth of Gate Points valid for 30 days, ensuring that higher-tier users still receive meaningful value.
Traffic Support and Platform Visibility
The traffic boost mechanisms are particularly valuable for content creators. Homepage features and red packet boosts provide exposure to Gate's substantial user base. The 13th Anniversary Traffic Pack gives new streamers immediate visibility through featured slots, helping them overcome the initial challenge of building an audience from zero. This support aligns with Gate's broader strategy of developing its live streaming ecosystem as a key component of its platform.
Event Mechanics and Participation Requirements
All participants must click the Join Now button and complete identity verification before the event ends to be eligible for rewards. This verification requirement ensures compliance with regulatory standards and prevents fraudulent participation. Streamers must adhere to all platform rules, and content is evaluated by official staff to ensure quality. Idle streaming, non-cryptocurrency content, or simply playing videos do not qualify, maintaining the integrity of the live streaming environment.
The event explicitly excludes users from restricted locations including the United Kingdom, in compliance with regulatory requirements. Rewards are distributed to Gate spot accounts within 14 business days after the event concludes, with winners announced on Gate Live's official post account and X (formerly Twitter) account.
Strategic Significance
This 13th Anniversary celebration represents more than just a marketing event. It reflects Gate's evolution from a simple exchange to a comprehensive ecosystem including social features, content creation, and community engagement. By incentivizing both content creation and consumption, Gate is building a self-sustaining live streaming community that can drive user retention and platform loyalty. The integration of trading activity into the reward structure, particularly the 20 percent ranking boost for viewers who complete trades, demonstrates how Gate is weaving together its various platform features.
The anniversary timing is significant as it coincides with a period of maturation in the cryptocurrency industry. After 13 years, Gate has weathered multiple market cycles and established itself as one of the longer-standing platforms in a space known for high turnover. The celebration serves as both a thank you to existing users and an acquisition tool for new participants.
CEO Dr. Han's message framing the 13th year as a new starting point suggests ambitious plans for future development. The emphasis on serving 50 million plus users highlights the scale Gate has achieved while the live streaming focus indicates where future growth is expected. The carnival format, with its multiple reward tiers and engagement mechanisms, creates numerous touchpoints for users to interact with the platform, potentially converting casual viewers into active traders and content consumers into community contributors.
The event runs for a full month, from April 20 to May 20, 2026, providing ample time for participants to engage with the various programs and for the platform to capture sustained attention rather than just a one-day spike in activity. This extended timeline allows for organic growth of viewership as word spreads about the rewards and quality content emerges from the participating streamers.
Overall, the Gate Live 13th Anniversary Carnival represents a well-structured celebration that rewards different types of platform engagement while reinforcing Gate's position as a comprehensive cryptocurrency ecosystem rather than just a trading venue.
repost-content-media
  • Reward
  • 1
  • Repost
  • Share
CryptoDiscovery:
To The Moon 🌕
#OpenAIReleasesGPT-5.5
OpenAI Releases GPT-5.5 🚀
The Next Evolution in AI for Real-World Work
OpenAI officially launched GPT-5.5 on April 23, 2026, introducing a major upgrade in how artificial intelligence works in real-world environments. This is not just another chatbot update — it’s a shift toward smarter, more independent AI that can actually handle complex tasks with minimal human input.
What Makes GPT-5.5 Different?
GPT-5.5 focuses on autonomy, efficiency, and deeper reasoning. Unlike older models that needed very clear instructions, this version can:
Understand incomplete or complex
HighAmbition
#OpenAIReleasesGPT-5.5
OpenAI Releases GPT-5.5 🚀
The Next Evolution in AI for Real-World Work
OpenAI officially launched GPT-5.5 on April 23, 2026, introducing a major upgrade in how artificial intelligence works in real-world environments. This is not just another chatbot update — it’s a shift toward smarter, more independent AI that can actually handle complex tasks with minimal human input.
What Makes GPT-5.5 Different?
GPT-5.5 focuses on autonomy, efficiency, and deeper reasoning. Unlike older models that needed very clear instructions, this version can:
Understand incomplete or complex prompts
Plan tasks step-by-step on its own
Execute multi-stage workflows
This means it can act more like a digital assistant rather than just a tool that answers questions.
Strong Performance & Benchmarks
GPT-5.5 has shown impressive results in technical evaluations:
Over 82% accuracy on advanced benchmarks like Terminal-Bench 2.0
High performance in coding tests like SWE-Bench Pro
Ability to solve real-world programming problems from start to finish
These results show that the model is becoming reliable enough for professional-level work, especially in tech fields.
Powerful for Developers 💻
One of the biggest improvements is in coding. GPT-5.5 can:
Debug complex systems
Work with large codebases
Suggest improvements before issues happen
Many developers are using it to save time and increase productivity, as it can handle tasks that usually require experienced engineers.
Better Efficiency = Lower Cost
GPT-5.5 delivers higher intelligence while:
Keeping response speed similar to earlier models
Using fewer tokens (more efficient processing)
This makes it more affordable and practical for businesses using AI at scale.
Massive Context Window 📊
The model supports up to 1 million tokens, allowing it to:
Analyze long documents
Handle large datasets
Maintain context over long conversations
This is especially useful in industries like finance, law, and research, where large amounts of data need to be processed at once.
Safety & Reliability
Safety remains a priority. OpenAI has added:
Advanced testing and red-teaming
Strong safety controls
Risk management systems
The goal is to ensure powerful performance while keeping usage responsible and controlled.
Availability
GPT-5.5 is currently available to premium users, with wider API access expected soon. The rollout is gradual to ensure stability and safety before mass adoption.
What This Means for the Future
GPT-5.5 is a big step toward autonomous AI agents that can manage entire workflows on their own. Businesses are already using it for:
Automation
Data analysis
Decision-making support
This shows that AI is moving from being a helper to becoming a true working partner.
Final Thoughts
GPT-5.5 is more than just an upgrade — it’s a transformation. With better reasoning, higher efficiency, and real-world usability, it sets a new standard for AI systems. As adoption grows, it will continue to reshape industries and redefine how humans and AI work together.
repost-content-media
  • Reward
  • Comment
  • Repost
  • Share
#FirstTradeOfTheWeek
#FirstTradeOfTheWeek 🔥
Genius Coin Weekly Trading Plan | April 2026
Current Price: $0.6488
🌍 SCENARIO 1: BULLISH MOMENTUM
Market Context:
Altcoins gaining traction
Bitcoin holding strong above key levels
Mid-cap coins attracting fresh liquidity
Expected Move:
👉 $0.6488 → $0.68 → $0.72 → $0.78 → $0.85
Key Support Zones:
$0.62 (short-term support)
$0.60 (strong accumulation)
$0.55 (major demand zone)
📌 Bullish Trigger: Breakout and hold above $0.68
📌 Stop Loss (Longs): Below $0.61
Behavior:
Strong breakout spikes
Momentum continuation after resistance flip
Increas
BTC-0,67%
HighAmbition
#FirstTradeOfTheWeek
#FirstTradeOfTheWeek 🔥
Genius Coin Weekly Trading Plan | April 2026
Current Price: $0.6488
🌍 SCENARIO 1: BULLISH MOMENTUM
Market Context:
Altcoins gaining traction
Bitcoin holding strong above key levels
Mid-cap coins attracting fresh liquidity
Expected Move:
👉 $0.6488 → $0.68 → $0.72 → $0.78 → $0.85
Key Support Zones:
$0.62 (short-term support)
$0.60 (strong accumulation)
$0.55 (major demand zone)
📌 Bullish Trigger: Breakout and hold above $0.68
📌 Stop Loss (Longs): Below $0.61
Behavior:
Strong breakout spikes
Momentum continuation after resistance flip
Increasing volume + retail interest
🔴 SCENARIO 2: BEARISH CORRECTION
Market Context:
BTC shows weakness
Altcoins losing momentum
Profit-taking pressure increases
Expected Move:
👉 $0.6488 → $0.62 → $0.60 → $0.55 → $0.50
🟢 Key Levels:
$0.62 (first support)
$0.60 (trend level)
$0.55 (major base)
📌 Bearish Trigger: Breakdown below $0.62
📌 Stop Loss (Shorts): Above $0.69
🧠 Behavior:
Slow bleed or sharp drop
Weak recovery bounces
Lower highs formation
RANGE SCENARIO (SHORT TERM LIKELY)
📊 Range:
👉 $0.62 ↔ $0.68
📈 Scalp Flow:
$0.63 → $0.67 → $0.64 → $0.66 → $0.62 → $0.68
🧠 Behavior:
Fake breakouts
Liquidity grabs both sides
Sideways consolidation
FINAL WEEKLY VIEW
👉 $0.68 = key resistance zone
👉 Break above $0.68 = bullish continuation
👉 Lose $0.62 = downside pressure
👉 Currently range-bound with breakout potential
TRADER RULE
✔ Don’t chase pumps
✔ Wait for confirmation above resistance
✔ Follow Bitcoin direction
✔ Use strict risk management (high volatility coin)
Summary:
Genius Coin is trading in a tight range near $0.6488. A breakout above $0.68 or breakdown below $0.62 will decide the next major move — until then, expect choppy price action with short-term trading opportunities.
repost-content-media
  • Reward
  • Comment
  • Repost
  • Share
#CryptoMarketSeesVolatility
The Geopolitical Storm: How US-Iran Tensions Are Reshaping Crypto Markets, Oil Prices, and the Global Economy
The world is witnessing one of the most volatile geopolitical periods in recent memory as negotiations between the United States and Iran have stalled, creating ripple effects across cryptocurrency markets, energy prices, and the broader global economy. This comprehensive analysis examines why talks have faltered, how Bitcoin and the crypto market are responding, and what this means for oil prices and the international economic landscape.
Why US-Iran Talks
HighAmbition
#CryptoMarketSeesVolatility
The Geopolitical Storm: How US-Iran Tensions Are Reshaping Crypto Markets, Oil Prices, and the Global Economy
The world is witnessing one of the most volatile geopolitical periods in recent memory as negotiations between the United States and Iran have stalled, creating ripple effects across cryptocurrency markets, energy prices, and the broader global economy. This comprehensive analysis examines why talks have faltered, how Bitcoin and the crypto market are responding, and what this means for oil prices and the international economic landscape.
Why US-Iran Talks Have Stalled
The current impasse in US-Iran negotiations stems from multiple complex factors that have created an increasingly hostile diplomatic environment. President Donald Trump has maintained a hardline stance, insisting on continuing the naval blockade of the Strait of Hormuz even after Iran announced it would reopen the critical waterway following a ceasefire announcement. Iran has responded by refusing to send its negotiating team to planned talks in Islamabad until the United States lifts this blockade, creating a diplomatic standoff that shows no immediate signs of resolution.
The fundamental disagreements extend beyond the blockade issue. Washington has been piling sanctions on the Iranian economy since Trump withdrew from the multilateral nuclear deal in 2018 during his first term. The United States recently issued new sanctions targeting ships selling Iranian oil to fund the country's ballistic missile program. President Trump has continued issuing threats against Iran, warning that "lots of bombs will start going off" if no agreement is reached before the fragile ceasefire expires.
From Iran's perspective, the Supreme National Security Council and Ayatollah Mojtaba Khamenei must approve any major decisions such as long-term uranium enrichment suspension. Iranian Foreign Minister Abbas Araghchi has stated that a "fair and balanced" agreement is possible, but both Tehran and Washington face domestic constraints that could prevent an agreement even as they explore renewed negotiations following their 12-day conflict in June 2025.
US Military Strength Posturing
The United States has significantly ramped up its military presence and pressure tactics in the region. The US Navy has maintained a blockade of the Strait of Hormuz, intercepting Iranian tankers and preventing Iranian vessels from passing through this critical chokepoint that handles roughly one-fifth of global oil and LNG shipments. This show of force is designed to pressure Iran into compliance while demonstrating American resolve.
The military posturing extends beyond naval operations. The US joined Israel in bombing campaigns against Iranian nuclear sites in June 2025, and President Trump has hinted at considering limited military strikes on Iran. The administration's approach combines economic sanctions, military threats, and diplomatic pressure in what appears to be a maximum pressure campaign designed to force Iranian capitulation.
Cryptocurrency Market Volatility and Bitcoin's Response
The cryptocurrency market has experienced significant turbulence in response to these geopolitical developments. Bitcoin, which initially traded above $105,000 during the Israel-Iran conflict window in June 2025, has shown remarkable resilience despite the ongoing tensions. Currently trading around $77,800, Bitcoin has maintained stability between $60,000 and $70,000 during periods of peak tension, though recent recovery suggests the market may not have completed its upward movement.
The current price action shows Bitcoin testing resistance levels around $74,000 to $76,000, with key support established at $70,000. Technical indicators present a mixed picture: the 15-minute and 4-hour timeframes show bullish momentum with moving averages in bullish alignment, but the daily timeframe reveals potential concerns with MACD showing bearish divergence and CCI and WR indicators suggesting overbought conditions. The market sentiment remains cautiously optimistic, with institutional inflows providing underlying support through spot Bitcoin ETFs.
Several factors have driven Bitcoin's recovery from its 2026 low of approximately $60,000. Strategy's massive $2.54 billion Bitcoin purchase of 34,164 BTC provided significant bullish momentum. Continued spot Bitcoin ETF inflows totaling $996 million over the past week, combined with whale accumulation of 270,000 BTC over 30 days and exchange reserves hitting 7-year lows at 2.21 million BTC, have created a supply-constrained environment that supports prices.
Bitcoin Price Forecast and Trading Strategy
Technical analysis suggests Bitcoin needs a daily close above $80,000 to open the path toward $90,000. Failure to break through this resistance could lead to another move lower, potentially revisiting support areas closer to $70,000 or even lower levels. The cryptocurrency has established a well-defined trading range between $70,000 support and $76,000 resistance.
For traders, the current environment requires careful risk management. The geopolitical uncertainty creates potential for sudden volatility spikes. A prudent approach would involve monitoring key support levels at $70,000 and $68,000, with resistance targets at $74,800, $76,000, and ultimately $80,000. Given the mixed technical signals, position sizing should reflect the heightened uncertainty, with stop-losses placed below major support levels.
Institutional flows remain a critical factor to watch. BlackRock's iShares Bitcoin Trust has attracted significant inflows, and Morgan Stanley's spot Bitcoin ETF recently accumulated over $139 million worth of BTC in just nine days of trading. This institutional adoption has evolved from speculative curiosity to strategic portfolio allocation, providing a potential floor for prices during risk-off periods.
Oil Market Dynamics and Price Trajectory
The oil market has experienced dramatic price swings as tensions have escalated and de-escalated. During the June 2025 Israel-Iran conflict window, oil jumped from the mid-$60s to the low-$70s. More recently, when Iran announced it would reopen the Strait of Hormuz during a ceasefire, oil prices plunged more than 9% to around $90 per barrel. However, as talks stalled again, uncertainty returned to the market.
The Strait of Hormuz remains the critical variable for oil prices. Any sustained closure or military activity near this waterway threatens nearly a fifth of global oil supply, amplifying volatility across energy markets. Analysts at Goldman Sachs have noted that prolonged disruption could have severe implications for global energy security.
Looking ahead, oil prices face significant upside risk if tensions persist. Rystad Energy has warned that if oil prices push through to and sustain $100 per barrel, it could unlock as much as 2.1 million barrels per day of new supply from South America. However, in a severe scenario where energy supply dislocations extend into next year, prices could spike significantly higher, potentially reaching $140 per barrel according to some analysts.
Global Economic Outlook and Recession Risks
The International Monetary Fund has issued stark warnings about the potential for global economic damage from the ongoing conflict. The IMF has cut its global growth forecast to 3.1% for 2026, down from 3.3% forecast in January. More concerning is the severe scenario analysis: if the conflict extends and deepens with high oil prices, global growth could decline to just 2%, putting the world on the edge of recession.
Inflation expectations have been revised upward significantly. The IMF now expects global inflation to reach 4.4% in 2026, up from 4.1% in 2025 and higher than the 3.8% forecast earlier this year. In the severe scenario, inflation could exceed 6%, creating stagflationary conditions that would challenge central banks worldwide.
The Federal Reserve has been forced to delay rate cuts due to war-related inflation risks. A Reuters poll indicates that most economists now expect the Fed to remain on hold for at least six months, with the first rate cut potentially pushed back to late 2026. The Fed's preferred inflation gauge, the Personal Consumption Expenditures Price Index, is now expected to rise by annual rates of 3.7%, 3.4%, and 3.2% in the second, third, and fourth quarters respectively.
European economies face particular challenges. The 21 eurozone countries are expected to grow just 1.1% collectively this year, down from 1.4% in 2025, as soaring natural gas prices impact industrial output and consumer spending. Saudi Arabia's growth forecast has been sharply lowered to 3.1% from 4.5%, while the broader Middle East and North Africa region faces a 2.8 percentage point reduction to just 1.1% growth.
The Path Forward
The current situation remains highly fluid. President Trump extended the ceasefire deadline with Iran to allow Tehran time to present a unified proposal, but optimism for a lasting peace remains low. The fundamental sticking points include sanctions relief, uranium enrichment limits, and the risk of empowering hardline Iranian leaders who crushed nationwide protests in January.
For investors and traders across all asset classes, the key takeaway is that geopolitical risk premium remains elevated. Cryptocurrency markets have shown surprising resilience, suggesting that much of the geopolitical tail risk may already be priced in. However, the potential for sudden escalation remains, requiring careful position management and attention to developments in the Strait of Hormuz.
Oil prices will likely remain volatile, with upside bias until a durable diplomatic solution emerges. The global economy faces significant headwinds, with recession risks elevated if the conflict persists. Central banks find themselves in a difficult position, needing to balance inflation concerns against growth risks in an environment of extreme uncertainty.
The coming weeks will be critical as ceasefire deadlines approach and diplomatic efforts continue. Markets will be watching closely for any signs of breakthrough or breakdown in negotiations, with the potential for significant price movements across all asset classes depending on the outcome.
repost-content-media
  • Reward
  • Comment
  • Repost
  • Share
#ETHMemeCoinFLORKSurges
ETH Meme Coin FLORK: The Surge That Captured Trader Attention
The cryptocurrency market has witnessed another remarkable meme coin phenomenon with FLORK, an Ethereum-based token that has experienced explosive growth in recent days. This article provides a comprehensive analysis of the surge, current pricing, forecast expectations, and strategic trading approaches that traders are currently considering.
Understanding the FLORK Surge
FLORK represents a fascinating case study in the meme coin sector. According to recent market data, this Ethereum chain meme coin achieved
HighAmbition
#ETHMemeCoinFLORKSurges
ETH Meme Coin FLORK: The Surge That Captured Trader Attention
The cryptocurrency market has witnessed another remarkable meme coin phenomenon with FLORK, an Ethereum-based token that has experienced explosive growth in recent days. This article provides a comprehensive analysis of the surge, current pricing, forecast expectations, and strategic trading approaches that traders are currently considering.
Understanding the FLORK Surge
FLORK represents a fascinating case study in the meme coin sector. According to recent market data, this Ethereum chain meme coin achieved an extraordinary 80% surge within just one hour, pushing its market capitalization beyond $15 million at its peak. The token has demonstrated remarkable resilience with a 24-hour gain exceeding 110% and trading volume reaching $11.2 million during the same period. At current levels, FLORK maintains a market cap around $12.7 million, showing sustained interest from the trading community.
The surge was not merely a random pump but was catalyzed by significant social media exposure. The token gained substantial traction when Nikita Bier, Head of Product at X (formerly Twitter), featured the Flork logo in a video demonstration for the platform's new Custom Timelines feature. This exposure transformed FLORK from an obscure token trading around $100,000-$116,000 market cap into a multi-million dollar asset, delivering over 100x returns for early adopters who recognized the narrative potential.
Current Price Position and Market Structure
As of the latest data, FLORK trades at approximately $0.000108 with significant volatility characteristics typical of meme coins. The token has established a 24-hour trading range between $0.000028 and $0.000110, demonstrating the extreme price swings that define this asset class. The current market capitalization stands at approximately $12-13 million, positioning it as a mid-tier meme coin with room for further appreciation.
The trading volume of $11.2 million in 24 hours indicates strong liquidity and active market participation. This volume level suggests genuine trading interest rather than artificial pumping, providing some confidence for traders considering entry positions. The token has also secured listings on centralized exchanges including KCEX and Poloniex, expanding accessibility beyond decentralized platforms.
Price Forecast and Growth Potential
Analysts and market observers have presented varying forecasts for FLORK's trajectory. Conservative estimates suggest the token could reach $0.000333 by 2025, representing modest growth from current levels. However, more optimistic projections based on meme coin historical patterns indicate potential for significantly higher valuations if the narrative momentum continues.
The technical setup suggests FLORK could experience further appreciation if it maintains community engagement and social media presence. Targets in the $25-50 million market cap range appear achievable if the current momentum persists, representing potential gains of 2-4x from current levels. Some community members speculate about even higher valuations, though such projections remain highly speculative and dependent on continued viral growth.
Traders should note that FLORK has already demonstrated the ability to recover from significant pullbacks. After reaching peaks around $15-18 million market cap, the token experienced corrections to approximately $3-8 million range before stabilizing and showing signs of renewed accumulation. This pattern suggests underlying support from committed holders who believe in the token's longer-term potential.
Trading Strategy Considerations
Successful trading of FLORK requires understanding the unique dynamics of meme coin markets. The following strategic approaches have emerged from analyzing trader behavior and market patterns:
Entry strategies should focus on either breakout momentum or strategic dip buying. Breakout entries work best when the token closes above recent resistance levels with volume confirmation exceeding twice the average hourly trading activity. Dip buying opportunities emerge during 20-40% corrections from recent highs, particularly when support levels around $6-8 million market cap are tested.
Risk management remains paramount given the extreme volatility inherent in meme coins. Position sizing should remain conservative, with individual trades representing no more than 1-2% of total portfolio value. Stop-loss levels should be established 15-25% below entry points to protect against rapid drawdowns that can occur when sentiment shifts.
Profit-taking strategies benefit from tiered approaches rather than single exit points. Taking 30% of position off at 1.5x gains locks in initial profits while maintaining exposure to further upside. Additional 30% can be removed at 3x targets, with final 40% reserved for potential moonshot scenarios if the token achieves $50 million or higher valuations.
Timing considerations favor high-liquidity periods during US and European trading sessions. Weekend trading often shows reduced volume and increased volatility, making position management more challenging. Traders should monitor social media sentiment continuously, as meme coins derive significant value from community engagement and viral narrative development.
What Traders Are Thinking
The trader community exhibits mixed but generally optimistic sentiment toward FLORK. Bullish participants emphasize the token's OG status on Ethereum, the X platform connection through Nikita Bier's involvement, and the organic community growth that has developed around the Flork frog meme narrative. The token's association with X's unofficial meme category positioning provides a unique value proposition that distinguishes it from countless other meme coins.
Concerns among more cautious traders center on the typical risks associated with meme coin investments. The lack of fundamental utility, dependence on social media sentiment, and history of dramatic price corrections create significant downside risks. Some traders note that FLORK's rapid appreciation may have already captured much of the easy gains, leaving limited upside for late entrants.
The broader ETH meme coin ecosystem currently shows rotation patterns, with traders moving between tokens like ASTEROID, PUNK, WOJAK, and FLORK based on which narrative gains temporary dominance. FLORK's positioning as a potential X platform mascot gives it staying power that many competitors lack, though this advantage requires continued validation through platform developments and community engagement.
Next Steps and Strategic Planning
Traders considering FLORK should establish clear entry criteria based on technical levels and volume patterns. Current support zones around $8-9 million market cap offer potential accumulation opportunities, while resistance near previous highs around $15-18 million will test the strength of bullish conviction.
Monitoring tools should include DexScreener for real-time price action, BubbleMaps for whale wallet tracking, and LunarCrush for social sentiment analysis. X platform monitoring remains essential given the token's dependence on social media narrative development.
The path forward for FLORK depends heavily on continued community engagement and any additional endorsements or integrations with the X platform. Traders should remain prepared for extreme volatility, with price swings of 50% or more occurring within single trading sessions. Success in this market requires emotional discipline, strict risk management, and willingness to exit positions when momentum shifts regardless of unrealized gains.
FLORK represents the high-risk, high-reward nature of meme coin trading in its purest form. While the surge has already delivered life-changing returns for early participants, the token's future trajectory remains highly uncertain and dependent on factors largely outside traditional financial analysis. Traders should approach with appropriate position sizing, clear risk parameters, and full awareness that meme coins can lose 90% or more of their value rapidly when sentiment turns negative.
repost-content-media
  • Reward
  • Comment
  • Repost
  • Share
#WCTCTradingKingPK
Advanced Multi-Timeframe Momentum Strategy for WCTC S8 Individual PK Competition
The Individual PK Competition in WCTC S8 demands a trading approach that balances aggressive return generation with disciplined risk management. This comprehensive strategy guide presents a multi-timeframe momentum system specifically optimized for the high-pressure environment of head-to-head trading battles where performance is measured over compressed time periods.
Core Strategy Philosophy
The foundation of this strategy rests on capturing explosive price movements while maintaining strict c
HighAmbition
#WCTCTradingKingPK
Advanced Multi-Timeframe Momentum Strategy for WCTC S8 Individual PK Competition
The Individual PK Competition in WCTC S8 demands a trading approach that balances aggressive return generation with disciplined risk management. This comprehensive strategy guide presents a multi-timeframe momentum system specifically optimized for the high-pressure environment of head-to-head trading battles where performance is measured over compressed time periods.
Core Strategy Philosophy
The foundation of this strategy rests on capturing explosive price movements while maintaining strict capital preservation protocols. Unlike traditional swing trading that might hold positions for days or weeks, PK competition trading requires rapid decision-making and quick profit realization. The strategy employs a three-layer confirmation system that filters noise and identifies high-probability momentum bursts across multiple timeframes.
Timeframe Architecture
The strategy utilizes four distinct timeframes working in concert. The monthly and weekly charts provide structural context for major support and resistance zones. The daily chart identifies the primary trend direction and key decision levels. The four-hour chart serves as the main execution timeframe where entry and exit signals are generated. Finally, the one-hour chart provides micro-structure for precise entry timing and stop-loss placement.
This multi-timeframe approach ensures that trades align with the broader market structure while allowing for tactical precision in execution. Trading against the higher timeframe trend significantly reduces win probability, so the strategy enforces strict trend alignment rules before any position is considered.
Technical Indicator Configuration
The primary momentum identification tool combines the Relative Strength Index with volume analysis. The RSI is configured with a 14-period setting on the daily chart to identify overbought and oversold conditions. Readings above 70 indicate overbought conditions suitable for short entries, while readings below 30 signal oversold conditions for long entries. However, the strategy only acts on these signals when they align with the higher timeframe trend direction.
Volume analysis uses the On-Balance Volume indicator to confirm momentum strength. Rising OBV during price advances confirms genuine buying interest, while falling OBV during price declines confirms selling pressure. Divergences between price and OBV serve as early warning signals for potential reversals.
Moving averages provide trend structure and dynamic support-resistance levels. The strategy employs the 50-period and 200-period exponential moving averages on the daily chart. Price above both averages indicates a strong uptrend, while price below both signals a strong downtrend. The 50 EMA acts as dynamic support in uptrends and resistance in downtrends.
Entry Signal Generation
Long entries trigger when three conditions align simultaneously. First, the daily RSI must read below 40, indicating the pair has pulled back from overbought conditions but maintains bullish structure. Second, price must test or slightly penetrate the 50 EMA on the daily chart, creating a high-probability support bounce scenario. Third, the four-hour chart must show a bullish engulfing candle or hammer pattern confirming buyer emergence at support.
Short entries reverse these conditions. The daily RSI must read above 60, price must test the 50 EMA from below as resistance, and the four-hour chart must display bearish engulfing or shooting star patterns confirming seller dominance at resistance.
Stop Loss Placement
Initial stop losses are placed 1.5 times the average true range below entry for long positions and above entry for short positions. This placement accounts for normal volatility while protecting against genuine trend reversals. The ATR uses a 14-period setting on the entry timeframe.
As trades move favorably, stops trail using a chandelier exit approach. The stop moves to the highest high minus three ATRs for long positions, or the lowest low plus three ATRs for short positions, calculated over the past five periods. This trailing method captures sustained trends while protecting accumulated profits.
Take Profit Strategy
The strategy employs a tiered profit-taking approach. The first 50 percent of the position closes at a 1.5 risk-reward ratio, securing base profits and reducing exposure. The remaining 50 percent continues with a trailing stop, capturing extended moves while maintaining upside participation.
For PK competition environments where rapid performance matters, an alternative aggressive approach closes 75 percent at 1.2 risk-reward and trails the final 25 percent with a tight 1 ATR stop. This method prioritizes quick wins while maintaining lottery ticket exposure to explosive moves.
Risk Management Framework
Individual trade risk is limited to 2 percent of account equity per position. This sizing allows for sustained performance even during losing streaks. The strategy expects win rates between 45 and 55 percent, making risk-reward ratios the primary profit driver.
Daily loss limits cap total account drawdown at 6 percent. Reaching this limit triggers mandatory trading cessation until the next session. This rule prevents emotional revenge trading that destroys accounts during adverse conditions.
Maximum position concentration limits exposure to any single trading pair at 25 percent of total account equity. This diversification prevents catastrophic losses from individual pair breakdowns or unexpected news events.
Market Selection Criteria
The strategy performs best on major cryptocurrency pairs with deep liquidity and tight spreads. BTC/USDT and ETH/USDT provide optimal conditions for consistent execution. These pairs exhibit clear trending behavior while maintaining sufficient volatility for meaningful profit generation.
Avoid trading during major news events or scheduled announcements. The strategy relies on technical patterns and momentum, which can be disrupted by fundamental shocks. Check economic calendars daily and reduce exposure ahead of high-impact events.
Session timing matters for execution quality. Asian session hours often provide cleaner technical setups with reduced noise. European and US sessions offer higher volatility but increased spread widening and slippage. Adapt position sizing to account for session-specific conditions.
Psychological Preparation
PK competition creates unique psychological pressures. The visible opponent and real-time performance comparison trigger competitive instincts that can override rational decision-making. Establish pre-competition routines that create mental clarity and emotional stability.
Develop specific trading plans before each session. Define which pairs you will trade, the conditions required for entry, and your maximum intended risk exposure. Having predetermined rules prevents impulsive decisions during fast-moving market conditions.
Accept that losses are part of the process. Even perfectly executed trades can fail due to random market behavior. Focus on process adherence rather than outcome obsession. Long-term profitability comes from consistent execution, not individual trade results.
Execution Checklist
Before entering any trade, verify all conditions align. Confirm higher timeframe trend direction matches your intended position. Check that RSI readings support the setup. Verify price action patterns on the execution timeframe. Calculate position size based on stop distance and risk limits. Place stop loss before entering the position. Define profit targets and exit strategy.
After entry, monitor price action without emotional attachment. Let stops and targets execute automatically. Avoid moving stops away from original placement unless following the trailing stop rules. Document each trade including entry reasoning, emotional state, and outcome for post-session review.
Competition-Specific Adaptations
PK competitions measure performance over fixed periods, creating different incentives than normal trading. Consider increasing position frequency while maintaining strict risk limits. Multiple small wins can accumulate faster than infrequent large wins in this environment.
Monitor your opponent's visible activity if the interface provides such information. Adapt your aggression level based on relative performance. If trailing significantly, consider selective size increases on high-conviction setups. If leading substantially, reduce risk to protect gains.
Time management matters in PK formats. Ensure you have adequate time remaining to execute your strategy. Avoid taking marginal setups late in competition periods when time constraints force premature exits.
Backtesting and Optimization
Validate the strategy through historical backtesting before deploying real capital. Test across multiple market conditions including trending, ranging, and volatile periods. Verify that performance remains positive across different cryptocurrency market cycles.
Optimize parameters periodically based on changing market conditions. However, avoid over-optimization that creates curve-fitted results. Focus on robust parameters that perform adequately across diverse conditions rather than perfect parameters that fail in live trading.
Paper trade the strategy for at least two weeks before PK competition participation. This practice familiarizes you with signal generation, entry timing, and emotional responses without financial risk.
Final Implementation Notes
Success in PK competition requires more than technical strategy. Physical preparation including adequate sleep, nutrition, and exercise directly impacts decision-making quality. Ensure your trading environment is free from distractions and technical issues.
Maintain detailed records of all trading activity. Review both winning and losing trades for lessons. Identify patterns in your decision-making that correlate with positive and negative outcomes. Continuous improvement separates consistent performers from occasional winners.
The WCTC S8 Individual PK Competition rewards traders who combine technical skill with emotional discipline. This strategy provides a framework for systematic decision-making, but ultimate success depends on your execution and adaptation to real-time market conditions. Trade with confidence, manage risk relentlessly, and let the results reflect your preparation.
repost-content-media
  • Reward
  • Comment
  • Repost
  • Share
#TradingStrategiesInChoppyMarkets
Trading Strategies in Choppy Markets: A Comprehensive Guide to Defense, Survival, and Psychological Mastery
The cryptocurrency market is known for volatility, but sideways and choppy conditions are equally challenging. When price moves within a range, traders feel the urge to force trades, often leading to losses and mental pressure. This guide focuses on three key areas: defining defense levels, avoiding traps, and managing trading anxiety.
Understanding the Nature of Sideways Markets
Sideways markets occur when price moves between support and resistance wit
BTC-0,67%
ATR-0,38%
HighAmbition
#TradingStrategiesInChoppyMarkets
Trading Strategies in Choppy Markets: A Comprehensive Guide to Defense, Survival, and Psychological Mastery
The cryptocurrency market is known for volatility, but sideways and choppy conditions are equally challenging. When price moves within a range, traders feel the urge to force trades, often leading to losses and mental pressure. This guide focuses on three key areas: defining defense levels, avoiding traps, and managing trading anxiety.
Understanding the Nature of Sideways Markets
Sideways markets occur when price moves between support and resistance without a clear trend. Price action looks random, with frequent fake breakouts that trap traders. These phases often appear after strong trends or during uncertainty.
The real danger isn’t lack of movement—it’s the illusion of opportunity. Small moves look like trends, pushing traders into overtrading. Survival depends not on trading more, but on knowing when not to trade.
My Essential Defense Level in Sideways Markets
My defense strategy focuses on capital protection through three pillars:
1. Reduced Risk Exposure
In trending markets, risk per trade may be 2–3%. In choppy markets, I reduce it to 1% max, with daily exposure capped at 3%. This limits losses and forces selective trading.
2. Volatility-Based Position Sizing
Using ATR (Average True Range), I adjust position size based on volatility. If volatility increases, position size decreases. If volatility compresses, I become cautious as breakouts may follow.
3. Cooling-Off Rule
After 2 consecutive losses, I take a 2-hour break. After 3 losses, I stop trading for the day. This prevents emotional revenge trading.
Additional rules:
Minimum 3 touches on support/resistance
Volume should expand at range edges
Risk-reward must be at least 3:1
If conditions aren’t met, I skip the trade.
Avoiding Dumps and Wick Traps
One of the biggest lessons I learned is proper stop-loss placement.
Most traders place stops at obvious levels, making them easy targets. Large players often push price into these zones to collect liquidity.
My solution: Volatility Buffer Strategy
Instead of placing stops directly at support/resistance, I use ATR:
Bitcoin: 2× ATR buffer
Altcoins: 2–3× ATR buffer
This allows room for natural price movement and avoids fake wicks.
Other protection methods:
Multi-timeframe confirmation (entry + higher + lower timeframe)
Position scaling (enter in parts instead of full size)
Time-based exits (close trade if no movement in 4–8 hours)
These methods reduce unnecessary losses and improve survival.
Managing Anxiety Without Trading
The hardest part of choppy markets is not trading.
1. Reframing Mindset
I treat sideways markets as recovery periods, not missed opportunities.
2. Stay Engaged Without Risk
I use paper trading and journaling instead of real trades.
3. Physical & Mental Control
Exercise and breathing techniques help reduce stress and improve focus.
4. Process-Based Success
I measure success by discipline, not profit.
5. Pre-Planned Rules
I define clear no-trade conditions before the week starts.
6. Urge Control
Instead of reacting, I observe the urge to trade—it usually fades.
7. Productive Alternatives
Backtesting, journaling, and learning replace impulsive trading.
Final Integration
Defense, protection, and psychology work together. Smaller risk allows wider stops, reducing stop-outs and stress. Better mindset improves decision-making.
The goal in choppy markets isn’t profit—it’s survival.
Successful traders don’t trade all the time. They wait for high-probability setups and protect capital during uncertain phases.
Markets will always shift between trending and sideways conditions. Those who master both environments build long-term success.
repost-content-media
  • Reward
  • Comment
  • Repost
  • Share
#VolatileMarketTradingStrategy
4/25 – 4/26 Gate Plaza Weekend Session:
Volatile Market Trading Strategy: A Comprehensive Guide
The cryptocurrency market never sleeps, and weekends present unique challenges for traders. When traditional markets close and liquidity thins out, volatility often spikes, creating both opportunities and traps. This guide explores practical strategies for navigating weekend volatility, protecting your capital, and maintaining psychological balance during uncertain market conditions.
Where to Set Your Defense Position in Weekend Volatile Markets
Setting up a proper def
HighAmbition
#VolatileMarketTradingStrategy
4/25 – 4/26 Gate Plaza Weekend Session:
Volatile Market Trading Strategy: A Comprehensive Guide
The cryptocurrency market never sleeps, and weekends present unique challenges for traders. When traditional markets close and liquidity thins out, volatility often spikes, creating both opportunities and traps. This guide explores practical strategies for navigating weekend volatility, protecting your capital, and maintaining psychological balance during uncertain market conditions.
Where to Set Your Defense Position in Weekend Volatile Markets
Setting up a proper defense position begins with position sizing. During weekends, reduce your overall exposure by thirty to fifty percent compared to weekday positions. This limits potential losses if the market moves against you unexpectedly and reduces emotional pressure during thin liquidity periods.
The location of your stop-loss orders requires careful consideration during weekends. Standard approaches often fail because weekend volatility can trigger stops unnecessarily. Instead of placing stops at obvious technical levels, consider using wider stops combined with smaller position sizes. This gives the market room to breathe while still protecting your account from catastrophic losses.
Diversify your weekend exposure across different timeframes and asset classes. Rather than concentrating all risk in a single high-volatility altcoin, spread positions across major cryptocurrencies like Bitcoin and Ethereum, which tend to have more stable weekend price action. Maintaining a portion of your portfolio in stablecoins provides both psychological comfort and tactical flexibility.
Timing of entries plays a crucial role. Friday evening entries should be approached with caution, as institutional traders close positions for the weekend, potentially creating artificial price movements. Sunday evening positions carry risk as markets prepare for Monday opening in traditional finance.
Establish clear rules before the weekend begins. Decide in advance what percentage of your portfolio will remain active, where stops will be placed, and under what conditions you will adjust positions. Having these decisions made prevents emotional decision-making when prices move rapidly.
Consider the layered stop-loss approach. Instead of a single stop-loss order, place multiple smaller stops at different levels. This allows you to exit portions of your position gradually rather than all at once, providing finer control over risk exposure during volatile periods.
Understanding correlation becomes important during weekend defense. Many altcoins exhibit high correlation with Bitcoin during low-liquidity periods. Avoid unintentionally doubling your risk by holding multiple positions that will likely move in the same direction.
Small Tips That Saved Me from Big Dumps and Spikes
Always check funding rates before holding positions through the weekend. Funding rates represent the cost of holding leveraged positions and can spike dramatically during volatile periods. A position that looks profitable can quickly become a loss generator if funding costs accumulate while you hold through a choppy weekend.
Set price alerts at key levels rather than staring at charts continuously. Weekend volatility creates rapid movements that trigger emotional reactions if you watch every tick. By setting alerts, you can step away from the screen and avoid the psychological toll of watching every small fluctuation.
Journal your weekend trades. After each session, spend ten minutes documenting what worked, what did not work, and how you felt. Over time, this reveals patterns in your decision-making that you might not notice in the moment.
Reduce leverage before weekends begin. If you normally trade with five times leverage, consider reducing to two or three times for weekend positions. This provides a buffer against wider price swings during low-liquidity periods.
Verify exchange maintenance schedules before the weekend. Nothing is more stressful than discovering your exchange is undergoing maintenance precisely when you need to adjust a position. Checking these schedules prevents situations where you are unable to manage your risk when needed.
Set multiple take-profit levels rather than a single target. By scaling out of positions gradually, you secure profits while maintaining exposure to further upside. This is particularly valuable during weekend spikes, where prices can move rapidly in your favor before reversing.
Monitor social media sentiment during weekends. While social media can be noisy, extreme sentiment readings often precede significant price movements. Use sentiment as a confirming factor for your technical analysis rather than trading based on social media alone.
Maintain a weekend-specific watchlist separate from your weekday trading list. Weekend markets behave differently, and certain assets that trade well during the week may become illiquid or excessively volatile. Focus on assets that maintain reasonable liquidity during weekend sessions.
Pay attention to the time of day when you make trading decisions. Many traders notice decision quality deteriorates during late-night hours. Set rules about when you will and will not make position adjustments to prevent emotionally-driven mistakes.
Pre-commit to maximum loss limits for each weekend. Decide the maximum amount you are willing to lose before the weekend begins. When you hit your limit, stop trading regardless of how convinced you are that the next trade will be a winner. This protects you from revenge trading.
Keep a portion of your capital specifically designated for weekend opportunities. This separation creates a natural limit on your weekend exposure and ensures your core trading capital remains protected.
Reducing Anxiety Without Trading When Markets Go Sideways
Sideways markets present unique psychological challenges. When prices refuse to move, the temptation to force trades becomes overwhelming. Many traders destroy their accounts not during volatile periods but during choppy, directionless markets where boredom drives poor decision-making.
Shift your focus from price action to education and research when markets are not presenting clear opportunities. Use that time to deepen your understanding of market dynamics, study new trading strategies, or research emerging projects. This transforms frustration into growth.
Physical exercise serves as an excellent anxiety management tool. The physiological stress of watching non-moving charts can be countered through physical activity. Going for a run, hitting the gym, or taking a long walk helps release tension. Many successful traders report that their best ideas come during or after physical exercise.
Practice paper trading during sideways periods to satisfy the urge to trade without risking real capital. Test new strategies or practice execution skills. This allows you to maintain your trading rhythm while protecting your account from losses that accompany forced trades in choppy conditions.
Meditation and mindfulness practices help many traders deal with sideways market anxiety. The discipline of sitting quietly and observing thoughts without judgment translates directly to trading discipline. When you can observe your desire to trade without automatically acting on it, you develop emotional control necessary to wait for genuine opportunities.
Set specific criteria that must be met before you will consider entering a trade. Write these down and commit to following them regardless of how bored or anxious you become. When the market is sideways, your criteria will naturally not be met, giving you objective permission to stay on the sidelines.
Connect with other traders during sideways periods for emotional support and perspective. Joining trading communities reminds you that you are not alone in experiencing frustration. Hearing others express similar sentiments helps normalize your feelings and prevents isolation that leads to impulsive decisions.
Review your past trades during sideways markets. This reinforces lessons from previous mistakes, reminds you of consequences of forced trades, and often reveals that your best trades came after periods of waiting. This strengthens your resolve to remain disciplined.
Set non-trading goals for sideways periods. Commit to learning a new skill for automated trading, reading books on market psychology, or developing a more sophisticated risk management system. These goals give you a sense of progress when markets are not cooperating.
Use visualization to manage sideways market anxiety. Spend time mentally rehearsing how you will handle the next major market move. Visualize yourself executing your strategy perfectly and capturing the opportunity that patient waiting has positioned you to take.
Temporarily adjust your chart timeframes during sideways periods. If you normally trade on hourly charts, switch to daily or weekly charts. Longer timeframes often reveal trends invisible on shorter scales, and reduced signal frequency naturally slows down trading activity.
Practice gratitude journaling to maintain perspective during difficult market conditions. Taking time to acknowledge positive aspects of your life outside trading creates emotional distance from market frustrations. When you recognize that your worth is not dependent on trading profits, anxiety diminishes.
Use sideways periods to improve your trading infrastructure. Organize watchlists, optimize chart layouts, test new indicators, or refine record-keeping systems. These improvements pay dividends when markets become active again.
Conclusion
Trading volatile weekend markets successfully requires technical skill, risk management discipline, and psychological resilience. By establishing clear defense positions, implementing protective practices, and developing healthy ways to manage anxiety during sideways markets, you position yourself for long-term success. The goal is not to eliminate all risk or capture every move, but to survive difficult periods with your capital and psychology intact so you can capitalize on opportunities that inevitably arise.
repost-content-media
  • Reward
  • Comment
  • Repost
  • Share
#CryptoMarketSeesVolatility
Crypto Market Volatility: A Comprehensive Analysis of Current Dynamics and Future Trajectory
The cryptocurrency market is currently experiencing significant volatility driven by a complex interplay of geopolitical tensions, macroeconomic uncertainty, and shifting institutional sentiment. Understanding these dynamics requires examining multiple interconnected factors that are reshaping the digital asset landscape.
Understanding Market Volatility: The Core Drivers
Market volatility in the crypto space stems from several fundamental sources. First, the inherent nature
HighAmbition
#CryptoMarketSeesVolatility
Crypto Market Volatility: A Comprehensive Analysis of Current Dynamics and Future Trajectory
The cryptocurrency market is currently experiencing significant volatility driven by a complex interplay of geopolitical tensions, macroeconomic uncertainty, and shifting institutional sentiment. Understanding these dynamics requires examining multiple interconnected factors that are reshaping the digital asset landscape.
Understanding Market Volatility: The Core Drivers
Market volatility in the crypto space stems from several fundamental sources. First, the inherent nature of cryptocurrency as an emerging asset class means it remains highly sensitive to sentiment shifts and liquidity flows. Unlike traditional markets with decades of established patterns, crypto markets are still discovering their equilibrium points. Second, the relatively lower market capitalization compared to traditional assets means that large institutional movements can create outsized price impacts. When major players like BlackRock or Strategy make significant moves, the entire market feels the ripple effects.
The current volatility intensification is particularly notable because it coincides with broader global uncertainty. Trade tensions between major economies, shifting monetary policies, and geopolitical conflicts are creating a perfect storm where traditional safe havens are being questioned, and crypto is caught in the crossfire of risk-on and risk-off sentiment swings.
The US-Iran Ceasefire Agreement: Latest Developments and Market Impact
The geopolitical situation surrounding the US-Iran ceasefire has become a critical factor influencing market sentiment. According to recent reports, a ceasefire between the United States and Iran was initially agreed upon on April8,2026, mediated by Pakistan, with a two-week duration. However, the situation has evolved rapidly with significant implications for global markets.
President Donald Trump announced that the ceasefire was set to expire on Wednesday evening Washington time, stating that an extension would be highly unlikely if a deal was not reached before the deadline. This hardline stance has created substantial uncertainty in global markets. The Iranian Foreign Ministry has indicated that the country does not have immediate plans to reengage with the United States, suggesting that diplomatic channels remain strained.
The situation has been further complicated by military actions in the Strait of Hormuz. Iran's Revolutionary Guard opened fire on a container ship in this critical waterway, damaging the vessel and raising stakes significantly. This attack followed US military seizures of Iranian vessels over the weekend. The Strait of Hormuz remains a crucial chokepoint for global oil shipments, and any disruption here has immediate cascading effects across energy markets and, by extension, risk assets including cryptocurrencies.
Trump has maintained that the blockade of Iranian ports will remain in place and has hinted at resuming attacks if the ceasefire expires without a comprehensive agreement. He has also claimed that Iran agreed to stop funding Hamas and Hezbollah and would hand over uranium, though Iranian officials have denied these claims. The next steps for negotiations remain unclear, with planned talks in Pakistan failing to materialize as expected.
Oil Prices and Global Demand: The Energy Market Connection
The connection between oil markets and crypto volatility cannot be overstated. Oil prices and global demand patterns serve as leading indicators for broader economic health, which directly impacts risk asset performance including cryptocurrencies.
Current oil market dynamics reveal a complex picture. According to the International Energy Agency, global oil demand growth has slowed significantly. In the third quarter of2025, demand increased by only0.8 million barrels per day, representing just0.7 percent year-on-year growth. This sluggish demand comes despite relatively lower prices, with Brent crude averaging around USD68 per barrel in August2025, marking the third consecutive month of price declines.
The World Bank has identified an oil market glut characterized by surging output and sluggish demand pressuring prices downward. This oversupply situation has created a bearish environment for energy markets. However, the Iran conflict has introduced significant supply risk premiums. Top oil traders from major firms like Gunvor Group and Trafigura have warned that demand destruction from the war could deepen substantially. Gunvor estimates that lost consumption may need to double to5 million barrels per day, roughly5 percent of world supplies, potentially triggering a global recession if the Strait of Hormuz remains closed for three months.
The energy shock is already rippling through global trade, with Morgan Stanley reporting that oil supply disruptions and shipping risks are pushing prices higher, raising costs for companies and consumers while threatening global demand and growth. This energy uncertainty creates a risk-off environment that typically pressures cryptocurrency prices as investors seek safety in traditional assets.
Bitcoin Current Status and Price Analysis
Bitcoin is currently trading at approximately77,615 USDT, showing a24-hour decline of about0.84 percent. The24-hour trading range has been between77,265 and78,480 USDT, with trading volume reaching approximately443 million USDT. Over the past seven days, Bitcoin has gained approximately5.17 percent, while the30-day performance shows a stronger uptrend of nearly16.88 percent.
Technical analysis reveals a mixed picture. On the15-minute timeframe, indicators suggest overbought conditions with CCI at108.97 and WR at negative6.96, indicating potential short-term exhaustion. The SAR indicator on the15-minute chart shows a bearish signal with the SAR point above recent average highs. However, the4-hour timeframe presents a more bullish outlook with MA7 above MA30 above MA120, forming a bullish alignment suggesting upward momentum. The daily SAR indicates bearish sentiment with the point above recent highs, suggesting caution at current levels.
Market sentiment analysis shows predominantly bullish social sentiment with68 percent positive content versus16 percent negative, resulting in a52 percent net positive differential. However, the fear and greed index currently reads31, indicating fear territory, which typically suggests caution among market participants.
Institutional activity remains a bright spot. Michael Saylor's Strategy has officially surpassed BlackRock as the largest single-entity Bitcoin holder, with Strategy holding815,061 BTC compared to BlackRock's802,823 BTC. BlackRock clients have been actively accumulating, with recent reports showing purchases of167.45 million and246.86 million USDT worth of Bitcoin on consecutive days. This institutional accumulation provides underlying support for prices even during volatile periods.
Price Forecast and Trading Strategy
Given the current market conditions, several scenarios emerge for Bitcoin's near-term trajectory. The immediate resistance level sits around83,000 USDT, which represents a critical psychological and technical barrier. Breaking above this level could open the path toward90,000 USDT and potentially retest the100,000 USDT milestone that was breached earlier this year.
However, downside risks remain significant. The77,000 USDT level is serving as immediate support, with a breakdown potentially targeting72,000 to75,000 USDT. The4-hour moving averages suggest the77,185 USDT level (MA30) provides dynamic support that bulls must defend to maintain the current uptrend structure.
For trading strategy, a range-bound approach appears most prudent given the volatility. Scalping the77,000 to79,000 USDT range with tight stops could capture short-term movements while limiting downside exposure. For swing traders, accumulating on dips toward the75,000 to77,000 USDT zone with targets at82,000 to85,000 USDT offers favorable risk-reward ratios.
Risk management is paramount in this environment. Position sizing should be reduced compared to normal conditions, with stop losses placed no wider than3 to5 percent from entry points. The high volatility environment means that moves of5 to10 percent can occur within hours, making disciplined risk management essential for capital preservation.
Future Trajectory: What Lies Ahead
The path forward for cryptocurrency markets depends heavily on several unresolved factors. First, the resolution or escalation of the US-Iran conflict will significantly impact risk sentiment. A peaceful resolution could trigger a relief rally across risk assets, while escalation would likely drive further risk-off behavior pressuring crypto prices lower.
Second, the trajectory of institutional adoption remains crucial. The continued accumulation by major players like BlackRock and Strategy provides a demand floor, but the pace of new institutional entrants will determine whether this support can translate into sustained price appreciation.
Third, regulatory developments, particularly in the United States, will shape market accessibility and sentiment. Any clarity on cryptocurrency regulation, potential strategic Bitcoin reserve initiatives, or favorable policy developments could serve as catalysts for the next major price movement.
Fourth, macroeconomic conditions including inflation trends, Federal Reserve policy, and global growth prospects will influence the broader risk asset environment within which cryptocurrencies operate.
Conclusion
The current crypto market volatility reflects a complex intersection of geopolitical uncertainty, energy market disruption, and shifting institutional sentiment. Bitcoin's current position around77,600 USDT represents a delicate balance between bullish institutional accumulation and bearish macro uncertainty. Traders should approach this environment with caution, employing strict risk management and maintaining flexibility to adapt as the geopolitical and macroeconomic landscape evolves. The coming weeks will be critical as the US-Iran situation develops and institutional flows continue to shape market dynamics.
repost-content-media
  • Reward
  • Comment
  • Repost
  • Share
#rsETHAttackUpdate
🚨 rsETH Incident 2026 – The Day DeFi Didn’t Break… But Everyone Realized It Can
There are days in crypto when nothing really changes — charts move, traders trade, noise continues — and then there are days like this, when suddenly the market goes quiet for a moment, not because nothing is happening, but because everyone is thinking at the same time, trying to process whether what just happened is a temporary disruption… or a deeper warning about the system itself.
The rsETH incident was not just another event — it was a reality check, a moment where confidence didn’t collap
ETH-0,63%
HighAmbition
#rsETHAttackUpdate
🚨 rsETH Incident 2026 – The Day DeFi Didn’t Break… But Everyone Realized It Can
There are days in crypto when nothing really changes — charts move, traders trade, noise continues — and then there are days like this, when suddenly the market goes quiet for a moment, not because nothing is happening, but because everyone is thinking at the same time, trying to process whether what just happened is a temporary disruption… or a deeper warning about the system itself.
The rsETH incident was not just another event — it was a reality check, a moment where confidence didn’t collapse, but it paused, where belief didn’t disappear, but it questioned itself, and where the biggest realization wasn’t about loss… but about how easily trust can be tested in a system built on layers of assumptions.
🔥 Let’s Be Honest — This Wasn’t “Just Another Incident”
At the surface, it looks like a technical issue tied to rsETH, with an impact crossing $290 million, but if you reduce it to just numbers, you completely miss the point — because what actually happened here was something far more important:
👉 The system accepted something it shouldn’t have
👉 The ecosystem reacted after the fact
👉 And users realized how much they rely on things they never fully analyze
And that creates a very uncomfortable thought:
How many other risks exist that simply haven’t been triggered yet?
⚠️ The Part Nobody Likes To Talk About
We often celebrate DeFi for being permissionless, open, and innovative — but we rarely talk about the trade-off:
👉 More freedom = more responsibility
👉 More innovation = more unknowns
👉 More yield = more hidden complexity
And this incident exposed exactly that — not loudly, not dramatically, but quietly and effectively — by showing that sometimes the biggest risks are not in what we see… but in what we assume is safe without questioning it.
🧠 The Debate That’s Dividing The Market Right Now
Let’s address the elephant in the room — because this is where things get interesting.
🔴 Side A — “This Is A Structural Warning”
This side isn’t panicking — they’re observing carefully, and their argument is simple but powerful:
If one weak point in a system can allow invalid value to move across protocols, interact with liquidity, and influence markets, then maybe the system is not as robust as we think — maybe complexity has moved faster than security, and maybe users are operating in environments where the true risk is not visible at the surface level.
And their biggest concern is not this incident —
It’s the next one.
🟢 Side B — “This Is Exactly How Systems Improve”
The other side sees this completely differently — not as a failure, but as a necessary stress event, because no system becomes strong without being tested, and no weakness gets fixed until it is exposed.
From this perspective, what happened is not the breakdown of DeFi — it is the process of refining it, strengthening it, and forcing it to evolve beyond theoretical security into real-world resilience.
💡 So Who’s Right? Here’s The Truth…
Both sides are right — and that’s what makes this moment so important.
Because this isn’t a black-and-white situation.
👉 DeFi is not broken
👉 DeFi is not perfect
👉 DeFi is being tested
And the outcome of this test will define the next phase of the market.
📊 Now Let’s Talk About What Really Matters — PRICE
Because in the end, markets don’t lie — sentiment, fear, confidence… everything shows up in price.
💰 Ethereum Current Price: ~$2318
Now pause for a second and think about this…
After a major DeFi shock, after headlines, after uncertainty…
👉 ETH is still holding above $2300
👉 Monthly trend is still positive (~+16%)
👉 Market structure is still intact
That is not weakness.
That is controlled strength.
🔍 Expanded Price Zones (Where The Game Is Being Played)
📍 Support Levels (Where Buyers Defend):
• $2300 → Key psychological level
• $2280 → Short-term reaction zone
• $2250 → Strong support (if tested, high attention area)
📍 Resistance Levels (Where Sellers React):
• $2332 → Immediate breakout trigger
• $2360 → Supply pressure zone
• $2400 → Major psychological barrier
• $2500 → Momentum expansion target
📈 What The Chart Is Really Saying
This is not a trending market…
This is not a collapsing market…
👉 This is a decision zone
Price is compressing, volatility is tightening, and the market is preparing for a move — the only question is direction.
And here’s the key insight most traders miss:
👉 Big moves don’t start with noise
👉 They start with silence and compression
🏦 Smart Money Isn’t Loud — But It’s Active
While retail traders are reacting emotionally, smart money is doing something very different:
👉 Not rushing in
👉 Not running away
👉 Just positioning quietly
This is what rebalancing looks like — not panic, not hype, but calculated patience.
⚡ The Brutal Truth Most Traders Ignore
Let’s be real for a second —
Most people in DeFi are not losing money because of hacks…
They’re losing because they:
• Don’t understand what they’re using
• Chase returns without thinking
• Ignore risk until it hits
And this incident didn’t create that problem —
It just exposed it.
📈 Strategy Right Now — This Is Where You Win Or Lose
This is not the time to be emotional.
This is the time to be precise.
🟢 If You’re Careful:
Wait for confirmation above $2332 — don’t guess, react
🟡 If You’re Strategic:
Look at $2300 zone for controlled entries with risk defined
🔴 If You’re Aggressive:
Trade short-term, take profits fast, don’t overstay
👉 One rule above all:
Survive first. Profit second.
🚀 What Happens Next — The Bigger Picture
This moment will shape the future of DeFi, not because something went wrong, but because now:
• Builders will tighten systems
• Investors will think deeper
• Risk will be priced more accurately
• Weak structures will get exposed
👉 And that’s how systems evolve.
💬 Final Thought — Read This Carefully
The biggest danger in crypto is not volatility.
It’s not even technical failure.
👉 It’s false confidence.
repost-content-media
  • Reward
  • Comment
  • Repost
  • Share
#US-IranTalksStall
US-Iran Peace Talks Stall: A Comprehensive Analysis
The peace negotiations between the United States and Iran have reached a critical impasse, with the first face-to-face high-level talks since 1979 ending without agreement in Islamabad, Pakistan. This diplomatic failure represents a fundamental blow to hopes of finding an off-ramp to the ongoing crisis that began on February 28, 2026.
Reasons for the Talks Failure
The negotiations collapsed due to two primary sticking points that remain irreconcilable between the parties. First, the United States demanded that Iran provide
HighAmbition
#US-IranTalksStall
US-Iran Peace Talks Stall: A Comprehensive Analysis
The peace negotiations between the United States and Iran have reached a critical impasse, with the first face-to-face high-level talks since 1979 ending without agreement in Islamabad, Pakistan. This diplomatic failure represents a fundamental blow to hopes of finding an off-ramp to the ongoing crisis that began on February 28, 2026.
Reasons for the Talks Failure
The negotiations collapsed due to two primary sticking points that remain irreconcilable between the parties. First, the United States demanded that Iran provide a firm commitment not to develop nuclear weapons, which Tehran refused to offer. Vice President JD Vance, who led the American delegation, stated that Iran had chosen not to accept the US proposal, leaving Washington with what he described as a final and best offer on the table.
Second, the management of the Strait of Hormuz emerged as a major obstacle. Iran insists on maintaining sovereign control over this critical waterway, demanding military oversight and toll collection from ships passing through. This position is unacceptable to the United States, Gulf states, and most other nations who view the strait as an international passage through which approximately one-fifth of global oil and liquefied natural gas flows.
Iranian officials attributed the talks failure to what they characterized as excessive American demands. The Iranian perspective holds that Washington entered negotiations seeking a quick solution following a two-week ceasefire implementation, while Tehran typically approaches diplomacy with a long-term negotiating strategy. This fundamental mismatch in diplomatic timelines and expectations created an unbridgeable gap.
Iranian Foreign Minister's Pakistan Visit and US Delegation
In a significant development, Iranian Foreign Minister Abbas Araghchi arrived in Islamabad on Friday, April 24, 2026, leading a small delegation for what officials described as bilateral consultations with Pakistani authorities. The visit was scheduled for approximately 10 PM local time, raising hopes that negotiations might resume.
However, Iranian state media clarified that Araghchi's visit was primarily bilateral in nature, intended for discussions with Pakistani officials rather than immediate direct talks with American negotiators. The Iranian proposal would be conveyed to the United States through Pakistani intermediaries.
President Donald Trump dispatched a US delegation led by Special Envoy Steve Witkoff and Jared Kushner to Pakistan for fresh talks with Iranian leadership. This represented a shift from Vice President Vance's earlier leadership of negotiations. The American delegation's arrival was contingent upon Iran's willingness to engage, which remained uncertain throughout the week.
Will There Be Peace or Escalation
The current trajectory suggests continued tension rather than immediate resolution. President Trump announced he was indefinitely extending the ceasefire with Iran while awaiting what he termed a unified proposal from Tehran. However, he simultaneously declared it highly unlikely he would extend the two-week ceasefire if no agreement is reached, stating he would not be rushed into making a bad deal.
Iran has taken provocative actions that complicate diplomatic efforts. Iranian forces seized ships in the Strait of Hormuz and opened fire on a container vessel, tightening their grip on the strategic waterway. The US Navy maintains its blockade of Iranian ports, which Tehran considers a violation of the ceasefire agreement.
Iranian Revolutionary Guard officials have issued threatening statements warning regional neighbors that if their territories are used to attack Iran, they must say goodbye to oil production in the Middle East. This rhetoric suggests Tehran is prepared to escalate rather than compromise on core demands.
Analysts assess that Iran could run out of oil storage capacity by April 26, 2026, creating additional pressure for resolution. However, Iran appears to calculate that maintaining its chokehold on the global economy through Strait of Hormuz control provides leverage that outweighs immediate economic costs.
Oil Prices and Global Market Impact
The diplomatic stalemate has sent shockwaves through global energy markets. Brent crude oil is trading at approximately 105.33 to 105.88 dollars per barrel, having surged roughly 12 percent in recent trading sessions. West Texas Intermediate crude stands near 94.40 dollars per barrel. These elevated prices represent some of the highest levels seen since the war began.
The Energy Information Administration forecasts that Brent crude prices will peak at 115 dollars per barrel in the second quarter of 2026 before potentially moderating. JPMorgan analysts project that oil prices still have further to rise because the market has not yet forced sufficient demand destruction to offset supply losses from the Iran conflict.
The Strait of Hormuz closure affects approximately 20 percent of global oil shipments and a significant portion of liquefied natural gas trade. Traffic through the waterway remains near standstill, and analysts caution that even if the strait reopens soon, Gulf oil production will require considerable time to ramp back up to normal levels.
Bitcoin Current Price and Forecast
Bitcoin is currently trading at approximately 77,602 dollars, showing remarkable resilience despite geopolitical turmoil. The cryptocurrency experienced only a modest 1.6 percent pullback following Iran's reimposition of controls on the Strait of Hormuz, significantly outperforming both oil markets and traditional equities.
Technical analysis indicates Bitcoin trades within an intraday range of approximately 77,265 to 78,479 dollars. The four-hour moving averages show a bullish configuration with MA7 exceeding MA30 and MA120, suggesting short-term upward momentum. However, daily chart indicators present a more mixed picture with the SAR indicator positioned above recent average highs.
Institutional flows remain supportive of Bitcoin prices. US spot Bitcoin ETFs absorbed approximately 1.9 billion dollars in net inflows over the past week, representing the strongest five-day stretch since early February. BlackRock's IBIT ETF alone captured 612 million dollars in inflows, with the asset manager reportedly purchasing roughly 280 million dollars worth of Bitcoin daily during peak flow periods.
Market sentiment analysis reveals predominantly bullish positioning, with approximately 66 percent of social media discussions expressing positive sentiment versus 18 percent negative. The Crypto Fear and Greed Index registers at 31, indicating cautious but not panic-driven market conditions.
Traders' Perspective and Market Sentiment
Professional traders and institutional investors are viewing the Iran conflict volatility as another notch on the belt of market challenges they have navigated over the past fifteen months. JPMorgan strategists note that markets have successfully absorbed numerous shocks including trade wars, government shutdowns, tariff escalations, and previous military conflicts.
Bitcoin's shrinking sell-off magnitude with each Iran-related shock suggests cryptocurrency markets may have largely priced in geopolitical tail risks. The spot ETF bid has emerged as a more reliable price floor than the futures-driven weekend gaps that characterized earlier market cycles. Traders are now monitoring bond yields, dollar strength, and key technical levels around 74,000 to 73,000 dollars to confirm Bitcoin's role as a geopolitical shock absorber.
However, some analysts question Bitcoin's safe-haven narrative, noting that it continues to trade more like a high-beta risk asset than a defensive hedge in the current environment. The cryptocurrency demonstrated this characteristic when it declined 4 percent following the House of Representatives' razor-thin rejection of a resolution to curb presidential war powers regarding Iran.
Consumer sentiment has plummeted to record lows, with the University of Michigan survey registering 47.6, lower than readings observed during the Great Recession, pandemic downturn, or subsequent inflation surge. Survey respondents specifically cited the Iran conflict as responsible for unfavorable economic changes.
Conclusion
The US-Iran peace talks stall reflects fundamental disagreements over nuclear non-proliferation commitments and control of strategic waterways. While both sides maintain rhetorical openness to continued dialogue, the practical obstacles to agreement remain substantial. Iran's Foreign Minister visit to Pakistan represents a potential diplomatic opening, but the pathway to substantive negotiations remains uncertain.
Oil prices will likely remain elevated above 100 dollars per barrel until supply disruptions resolve, creating inflationary pressures globally. Bitcoin has demonstrated resilience but faces conflicting narratives as both a safe-haven asset and a risk-correlated instrument. Traders should anticipate continued volatility across all asset classes until diplomatic clarity emerges or military escalation occurs.
The coming days represent a critical window as ceasefire deadlines approach and both sides evaluate whether compromise serves their strategic interests better than continued confrontation.
repost-content-media
  • Reward
  • Comment
  • Repost
  • Share
#USMilitaryMaduroBettingScandal
🚨 The US Military Maduro Betting Scandal: A Deep Structural Analysis of Power, Information, and Crypto Markets
There are rare moments when two completely different worlds collide in a way that forces everyone — from policymakers to traders — to rethink the systems they rely on, and this scandal is exactly one of those moments, where the lines between military intelligence, financial markets, and decentralized technology did not just blur, but fully intersect in a way that exposed both the power and the vulnerability of modern financial infrastructure.
The arre
HighAmbition
#USMilitaryMaduroBettingScandal
🚨 The US Military Maduro Betting Scandal: A Deep Structural Analysis of Power, Information, and Crypto Markets
There are rare moments when two completely different worlds collide in a way that forces everyone — from policymakers to traders — to rethink the systems they rely on, and this scandal is exactly one of those moments, where the lines between military intelligence, financial markets, and decentralized technology did not just blur, but fully intersect in a way that exposed both the power and the vulnerability of modern financial infrastructure.
The arrest of Master Sergeant Gannon Ken Van Dyke is not simply a legal case, nor is it just a story about one individual making unethical decisions — it is a case study in how privileged information, when combined with emerging financial tools like blockchain-based prediction markets, can create a completely new category of risk that traditional systems were never designed to handle.
🔥 The Operation and the Bet — Where Intelligence Became Opportunity
At the center of this case lies Operation Absolute Resolve, a covert US military mission executed on January 3, 2026, targeting Venezuelan President Nicolás Maduro — an operation that, in traditional contexts, would have remained within classified channels and strategic briefings, far removed from public speculation or financial exploitation — but in this instance, something fundamentally different happened.
Van Dyke, who was not merely an observer but an active participant in planning and execution, possessed access to highly sensitive, nonpublic information, including precise timelines, operational scope, and intended outcomes — information that, under normal circumstances, would carry immense national security implications — yet instead of treating this knowledge as a responsibility, it was allegedly converted into a financial edge.
Over a period spanning late December 2025 to early January 2026, he engaged with a blockchain-based prediction platform, placing multiple positions totaling approximately 33,000 USDC, strategically targeting outcomes that were not uncertain to him, but already known — effectively transforming classified intelligence into predictable market outcomes, which ultimately generated profits exceeding 400,000 USDC within days.
And this is where the case shifts from being unusual to being historically significant — because this is not just insider trading, but insider trading executed on a decentralized, transparent, and globally accessible financial layer.
⚖️ Legal Framework — Old Laws, New Battlefield
The charges brought forward — including wire fraud, commodities fraud, and misuse of confidential information — are rooted in traditional financial law, yet they are now being applied to a completely new environment, where transactions are recorded on public ledgers, identities can be pseudonymous, and platforms operate across jurisdictions.
This creates a fascinating tension:
👉 The law is old
👉 The technology is new
👉 And enforcement is adapting in real time
What makes this case particularly powerful is that it demonstrates that decentralization does not eliminate accountability — instead, it transforms how accountability is enforced, because while blockchain systems offer pseudonymity, they also create permanent, traceable records that can be analyzed, reconstructed, and linked back to real-world identities when sufficient investigative resources are applied.
🔍 Blockchain Transparency — A Double-Edged Reality
One of the most misunderstood aspects of cryptocurrency is the belief that it guarantees anonymity, when in reality it offers something far more complex — transparency without immediate identity, which can create a temporary illusion of privacy, but not absolute invisibility.
In this case, investigators were able to track transaction flows, analyze timing patterns, correlate wallet activity with external behavior, and ultimately build a narrative that connected digital actions to a physical individual — highlighting a critical truth that many market participants overlook:
👉 Blockchain does not hide activity
👉 It records it forever
And in situations involving high-value, high-confidence trades tied to real-world events, those records become extremely powerful evidence.
🏛️ Political and Regulatory Shockwaves
The response from political leadership, including comments from Donald Trump, reflects a broader uncertainty about how to approach this emerging space, where prediction markets can serve as tools for information aggregation on one hand, while simultaneously creating opportunities for exploitation on the other.
This duality is at the heart of the regulatory challenge — because banning such platforms outright may limit innovation, but ignoring them entirely creates systemic vulnerabilities that can be exploited by individuals with privileged access to information.
As a result, regulators are now being forced into a position where they must define clear boundaries for behavior in decentralized environments, rather than relying on assumptions that existing systems will naturally regulate themselves.
🏢 Platform Evolution — From Freedom to Controlled Integrity
Platforms like Polymarket and Kalshi are now entering a new phase of development, where pure decentralization is being balanced against the need for market integrity, surveillance, and compliance mechanisms that can prevent abuse without completely undermining accessibility.
This shift represents a broader trend within crypto:
👉 Early phase: Innovation without restriction
👉 Current phase: Innovation with accountability
👉 Future phase: Innovation with structured compliance
And the Van Dyke case may accelerate this transition significantly.
📊 Implications for the Crypto Market — Structural, Not Temporary
This scandal does not just impact prediction markets — it sends signals across the entire cryptocurrency ecosystem, particularly in areas like DeFi, derivatives, and event-based contracts, where information asymmetry can create unfair advantages if left unchecked.
It reinforces several key realities:
• Markets are not just driven by data — they are driven by who has access to that data first
• Decentralization reduces barriers — but does not eliminate ethical responsibility
• Transparency increases accountability — but only if enforcement follows
For institutional players, this case acts as both a warning and a validation — a warning that compliance risks are real, and a validation that enforcement mechanisms are becoming more effective.
🌍 Broader Market Dynamics — The Hidden Pattern
What makes this case even more important is that it is unlikely to be isolated, as similar trading patterns have already been observed around geopolitical and macro events, suggesting that prediction markets may increasingly attract participants who possess informational advantages — turning these platforms into battlegrounds between public speculation and private knowledge.
This raises a deeper question:
👉 Can a market truly be fair if some participants already know the outcome?
And more importantly:
👉 How do you regulate that in a decentralized system?
🚀 Future Outlook — Regulation Meets Reality
Looking forward, the impact of this case will likely extend far beyond the individuals involved, influencing regulatory frameworks, platform design, and user behavior across the crypto space.
We can expect:
• Increased monitoring of large, high-confidence trades
• Stronger collaboration between platforms and regulators
• Clearer legal definitions around insider activity in crypto
• Greater emphasis on identity-linked participation in certain markets
And while this may reduce some of the openness that defined early crypto, it may also increase trust, stability, and long-term adoption.
💬 Final Thought — The Real Lesson Behind The Scandal
This is not just a story about misuse of information, and it is not just a case about crypto regulation — it is a reflection of a deeper truth about modern markets:
👉 Technology evolves faster than behavior
👉 Access expands faster than understanding
👉 And opportunity often appears before rules are fully defined
The real question is not whether such incidents will happen again —
because they will —
The real question is:
👉 How quickly can systems adapt to ensure that innovation does not come at the cost of integrity?
repost-content-media
  • Reward
  • Comment
  • Repost
  • Share
#ETHMemeCoinFLORKSurges
🧠 Understanding FLORK – The Cultural Foundation Behind the Token
FLORK is not simply another speculative meme coin appearing in the Ethereum ecosystem, but rather it is an asset that carries a deeper cultural identity that originates from the long-running “Flork of Cows” webcomic series, which has existed in internet culture for many years and has built a recognizable identity through humor, simplicity, and community-driven creativity, and because of this background FLORK enters the crypto market with something most meme tokens completely lack, which is a pre-existing
HighAmbition
#ETHMemeCoinFLORKSurges
🧠 Understanding FLORK – The Cultural Foundation Behind the Token
FLORK is not simply another speculative meme coin appearing in the Ethereum ecosystem, but rather it is an asset that carries a deeper cultural identity that originates from the long-running “Flork of Cows” webcomic series, which has existed in internet culture for many years and has built a recognizable identity through humor, simplicity, and community-driven creativity, and because of this background FLORK enters the crypto market with something most meme tokens completely lack, which is a pre-existing emotional connection between internet users and the character itself.
The token was deployed on the Ethereum blockchain in April 2023, just one day after the launch of Pepe, which places it within the early wave of Ethereum meme coins that formed the foundation of what is now known as the meme economy, and this early positioning gives FLORK a unique classification as an “OG-style meme asset” that carries both historical presence and narrative strength, especially in a market where narrative often matters more than pure fundamentals in the short term.
📊 FLORK Price Action – Full Market Movement Breakdown
The recent performance of FLORK has been extremely aggressive and has captured the attention of traders across the Ethereum ecosystem, because within a very short time frame the token experienced a surge of nearly 1,800 percent within a single 24-hour period, which is an unusual level of volatility even by meme coin standards, and during this explosive phase the market capitalization expanded rapidly to around twelve million dollars before stabilizing in a lower consolidation range between eight and ten million dollars as early profit-taking activity entered the market.
The current trading price is approximately 0.00045 dollars, with intraday highs reaching around 0.00050 dollars and lows near 0.00040 dollars, while daily trading volume remains in the range of 1.2 million dollars, which indicates that despite the cooldown from peak levels there is still active participation and liquidity in the market rather than a complete exit of interest, and this type of behavior is often seen in meme assets that transition from pure hype phases into early stabilization phases where both buyers and sellers actively reprice value.
🔥 Primary Catalysts Behind FLORK’s Rapid Expansion
The first and most important driver behind FLORK’s recent surge is the broader narrative shift occurring within the Ethereum meme ecosystem, where liquidity and attention have begun rotating back toward Ethereum-based meme assets due to stronger holder conviction, deeper liquidity pools, and a more established trading environment compared to newer chains, which has created a favorable environment for tokens with strong narrative identity such as FLORK.
Another major contributing factor is the growing visibility of meme culture within major social platforms such as X (Twitter), where algorithmic exposure, trending integrations, and community-driven virality have significantly increased awareness of tokens like FLORK, allowing them to reach audiences far beyond their initial crypto-native user base and turning them into broader internet phenomena rather than isolated trading assets.
In addition to this, community-driven momentum has played a critical role in sustaining interest, because the rise of dedicated community accounts, influencer engagement, and continuous content creation has created a self-reinforcing cycle where attention generates liquidity and liquidity generates more attention, which is a core mechanism behind most successful meme coin cycles.
📈 Technical Structure – Market Behavior and Price Dynamics
From a structural perspective, FLORK is currently transitioning from a high-volatility expansion phase into a consolidation phase, where the market is attempting to establish a new equilibrium between buyers who are entering at elevated levels and early participants who are gradually taking profits, and this type of structure is very common after sharp parabolic movements in meme-driven assets.
The key support area is currently located near 0.00040 dollars, which represents the first defensive zone where buyers have previously shown interest, while a deeper support region exists around 0.00035 dollars, which would act as a stronger accumulation area if the market experiences a further retracement, whereas on the upside the immediate resistance level is positioned around 0.00050 dollars, and a successful breakout above this level could potentially open the path toward 0.00065 dollars and even the psychological milestone near 0.001 dollars if momentum returns strongly.
⚠️ Risk Structure and Trading Behavior Considerations
It is extremely important to understand that despite the strong upside potential associated with meme coins like FLORK, these assets operate in a highly speculative environment where price movements are often driven by sentiment, liquidity shifts, and narrative cycles rather than traditional valuation metrics, which means that while rapid gains are possible, equally sharp corrections can also occur without warning when momentum slows or when early holders begin distributing positions.
For this reason, disciplined risk management becomes essential, and position sizing should always remain conservative relative to overall portfolio size, because allocating small controlled exposure allows participation in upside movements while still protecting capital from unexpected volatility events that are common in meme-driven cycles.
🏦 Ethereum Market Context – The Core Liquidity Engine
The performance of FLORK is directly tied to the broader behavior of the Ethereum ecosystem, which currently trades around 2314 dollars and shows a mixed but stable macro structure with moderate short-term gains and a longer-term corrective phase that is gradually stabilizing, and this environment is particularly important because meme coin cycles historically perform best when Ethereum is neither in extreme bearish pressure nor fully parabolic, but rather in a phase of controlled recovery and liquidity expansion.
Trading volume in Ethereum remains healthy, and institutional participation continues to show steady accumulation patterns, which suggests that while the broader market is not aggressively trending upward, underlying demand is still present, and this creates a supportive environment for speculative assets like FLORK to temporarily outperform during rotation phases.
🐋 Smart Money Behavior and Market Positioning
One of the most important signals in the current market structure is the behavior of large holders and institutional participants, because data suggests that accumulation activity in Ethereum remains active, with significant wallet-level purchases occurring during dips, which indicates that long-term participants are not exiting the market but instead gradually increasing exposure in anticipation of future upside cycles.
This type of behavior typically reflects a transition phase where the market is neither in panic nor in full bullish expansion, but rather in a strategic accumulation zone where smart capital positions itself before broader retail participation returns, and historically these phases often precede stronger directional moves once liquidity conditions improve.
🚀 Forward Outlook – FLORK and ETH Market Cycle Interaction
Looking ahead, FLORK’s potential trajectory remains heavily dependent on the continuation of the Ethereum meme cycle, because if liquidity and narrative strength remain aligned, there is potential for further expansion ranging from moderate continuation moves to significantly higher multipliers depending on market conditions, whereas Ethereum itself continues to show structural stability with potential macro targets forming in the 3000 to 4000 dollar range if broader accumulation trends persist.
However, it must also be acknowledged that both assets operate in volatile environments, and while upside opportunities exist, they are always accompanied by risk of sudden corrections, which makes timing, patience, and risk management the most important factors for any participant in this market phase.
💬 Final Perspective – The Real Market Lesson
The true lesson from the FLORK surge and the broader Ethereum ecosystem movement is not simply about price action or percentage gains, but rather about understanding how narratives, liquidity, and timing intersect to create short-term opportunities within long-term evolving systems, and how markets often move not in straight lines but in cycles of expansion, consolidation, and re-accumulation that require both discipline and awareness to navigate successfully.
repost-content-media
  • Reward
  • Comment
  • Repost
  • Share
#WCTCTradingKingPK
Advanced Multi-Timeframe Momentum Strategy for WCTC S8 Individual PK Competition
The Individual PK Competition in WCTC S8 demands a trading approach that balances aggressive return generation with disciplined risk management. This comprehensive strategy guide presents a multi-timeframe momentum system specifically optimized for the high-pressure environment of head-to-head trading battles where performance is measured over compressed time periods.
Core Strategy Philosophy
The foundation of this strategy rests on capturing explosive price movements while maintaining strict c
HighAmbition
#WCTCTradingKingPK
Advanced Multi-Timeframe Momentum Strategy for WCTC S8 Individual PK Competition
The Individual PK Competition in WCTC S8 demands a trading approach that balances aggressive return generation with disciplined risk management. This comprehensive strategy guide presents a multi-timeframe momentum system specifically optimized for the high-pressure environment of head-to-head trading battles where performance is measured over compressed time periods.
Core Strategy Philosophy
The foundation of this strategy rests on capturing explosive price movements while maintaining strict capital preservation protocols. Unlike traditional swing trading that might hold positions for days or weeks, PK competition trading requires rapid decision-making and quick profit realization. The strategy employs a three-layer confirmation system that filters noise and identifies high-probability momentum bursts across multiple timeframes.
Timeframe Architecture
The strategy utilizes four distinct timeframes working in concert. The monthly and weekly charts provide structural context for major support and resistance zones. The daily chart identifies the primary trend direction and key decision levels. The four-hour chart serves as the main execution timeframe where entry and exit signals are generated. Finally, the one-hour chart provides micro-structure for precise entry timing and stop-loss placement.
This multi-timeframe approach ensures that trades align with the broader market structure while allowing for tactical precision in execution. Trading against the higher timeframe trend significantly reduces win probability, so the strategy enforces strict trend alignment rules before any position is considered.
Technical Indicator Configuration
The primary momentum identification tool combines the Relative Strength Index with volume analysis. The RSI is configured with a 14-period setting on the four-hour chart, with overbought and oversold thresholds adjusted to 75 and 25 respectively to account for cryptocurrency market volatility. Volume confirmation requires the current candle to exceed the 20-period average volume by at least fifty percent, ensuring that momentum signals coincide with genuine market participation rather than low-liquidity noise.
A secondary confirmation layer employs the Moving Average Convergence Divergence indicator with standard 12, 26, and 9 period settings. The strategy requires MACD histogram alignment with price momentum, meaning that bullish entries only trigger when both price and MACD histogram are making higher lows, while bearish entries require both to make lower highs.
The third confirmation element tracks exponential moving averages with 20, 50, and 200 period settings. The strategy mandates that price action must respect the 20-period EMA as dynamic support in uptrends and resistance in downtrends. Entries are only permitted when price pulls back to test the 20 EMA and demonstrates rejection through candlestick patterns.
Entry Protocol
Long entries trigger when four conditions align simultaneously. First, the daily chart must show a clearly defined uptrend with higher highs and higher lows. Second, the four-hour RSI must pullback from overbought territory to the 40-50 zone, indicating a healthy correction within the trend. Third, the MACD histogram must show bullish divergence or flattening before resuming upward expansion. Fourth, price must touch or slightly pierce the 20-period EMA on the four-hour chart and form a reversal candlestick pattern such as a hammer, morning star, or bullish engulfing.
Short entries follow the inverse logic with corresponding bearish requirements. The daily trend must be downward, the four-hour RSI must bounce from oversold to the 50-60 zone, MACD must show bearish characteristics, and price must reject from the 20 EMA with appropriate bearish candlestick confirmation.
Position Sizing and Risk Management
Capital allocation follows a dynamic position sizing model based on account equity and volatility conditions. The base position size starts at two percent of total trading capital per trade. This percentage increases to three percent when the Average True Range over fourteen periods falls below its 50-period average, indicating compressed volatility that often precedes explosive moves. Conversely, position size reduces to one percent when ATR exceeds its average by more than fifty percent, signaling elevated volatility and increased risk.
Stop-loss placement utilizes a dual-layer approach. The initial stop-loss sits at the swing low prior to entry for long positions or the swing high for short positions, ensuring that the trade invalidation point represents a genuine structural break rather than normal market noise. A secondary trailing stop activates once the position achieves a risk-to-reward ratio of one-to-one, locking in profits while allowing winners to run.
Profit Target Framework
The strategy employs a tiered profit-taking system designed to capture momentum while protecting gains. The first profit target sits at a one-point-five risk-to-reward ratio, where twenty-five percent of the position is closed. This initial partial exit ensures that the trade becomes risk-free while maintaining exposure to further gains. The second target at a two-point-five risk-to-reward ratio triggers closure of another fifty percent of the position. The final twenty-five percent trails with a stop-loss set at the second target level, capturing extended moves while protecting accumulated profits.
PK Competition Specific Adaptations
The Individual PK format introduces unique constraints that require strategic modifications. Competition rounds operate on fixed timeframes, typically ranging from hours to days, unlike normal trading where positions can be held indefinitely. This compressed timeline necessitates more aggressive entry criteria and faster profit realization.
The strategy adapts by reducing the confirmation period requirements. While standard implementation waits for daily candle closes, competition trading utilizes four-hour closes with one-hour micro-confirmation. This accelerates signal generation while maintaining structural validity.
Additionally, the PK environment benefits from correlation analysis across multiple trading pairs. When Bitcoin demonstrates strong momentum, altcoins often follow with amplified moves. The strategy monitors Bitcoin's four-hour structure as a leading indicator, entering altcoin positions only when Bitcoin confirms directional bias. This correlation filter significantly improves win rates by ensuring trades align with broad market sentiment.
Psychological Discipline Protocols
High-stakes competition trading amplifies emotional responses that destroy rational decision-making. The strategy incorporates specific protocols to maintain psychological equilibrium. Pre-session preparation includes reviewing trade rules, visualizing execution scenarios, and setting maximum daily loss limits at four percent of account equity. Once this limit triggers, all trading ceases regardless of market conditions or perceived opportunities.
During active trading, the strategy enforces a mandatory five-minute break after any losing trade. This cooling-off period prevents revenge trading and emotional escalation. Similarly, after three consecutive winning trades, a ten-minute break is required to prevent overconfidence and sloppy execution.
Market Condition Filters
Not all market environments support momentum trading effectively. The strategy identifies three distinct market regimes and adjusts accordingly. Trending markets with clear directional bias and healthy pullbacks represent ideal conditions where the strategy operates at full capacity. Choppy, range-bound markets with overlapping price action trigger a reduction in position size and wider stop-loss placement. Strongly trending markets with parabolic price action activate aggressive profit-taking and trailing stop protocols to protect against sudden reversals.
The Average Directional Index serves as the primary regime identification tool. Readings above thirty indicate trending conditions suitable for full strategy deployment. Readings between twenty and thirty suggest choppy conditions requiring caution. Readings below twenty signal ranging markets where the strategy remains inactive.
Execution Checklist
Every trade requires completion of a pre-entry checklist ensuring all conditions align. The checklist verifies trend alignment across timeframes, indicator confirmation, volume validation, risk-to-reward ratio minimum of one-to-two, and position size calculation. No trade proceeds without checklist completion, eliminating impulsive decisions and emotional overrides.
Post-trade analysis follows every closed position, documenting entry and exit rationale, emotional state, market conditions, and lessons learned. This continuous feedback loop drives strategy refinement and performance improvement over the competition period.
Advanced Techniques for Competitive Edge
Experienced traders can enhance the core strategy with additional techniques. Order flow analysis through volume profile identifies high-probability reaction zones where institutional participation concentrates. Market structure analysis tracks break of structure and change of character patterns that signal trend continuation or reversal. Multiple timeframe confluence zones where daily, four-hour, and one-hour support or resistance align provide exceptional risk-to-reward opportunities.
Correlation arbitrage between spot and perpetual futures markets occasionally presents risk-free profit opportunities during funding rate anomalies. While these situations are rare, monitoring funding rates every eight hours can capture additional returns without directional risk.
Performance Expectations and Reality
Successful implementation of this strategy in PK competition environments typically produces win rates between forty-five and fifty-five percent. While this appears modest, the asymmetric risk-to-reward structure ensures profitability. Average wins should exceed average losses by a factor of two to one or greater. This mathematical edge, compounded over multiple trades, generates the returns necessary for competitive performance.
Traders must abandon the pursuit of perfect trades and high win rates. Consistency, discipline, and adherence to proven mathematical edges outperform intuitive genius over time. The strategy provides the framework, but execution discipline determines ultimate success.
Final Implementation Notes
This strategy represents a complete trading system, not a collection of isolated indicators. Successful implementation requires thorough backtesting on historical data, paper trading to verify execution capability, and gradual capital deployment as proficiency develops. Modifying individual elements without understanding their systemic relationships typically degrades performance rather than improving it.
The WCTC S8 Individual PK Competition rewards traders who combine technical skill with psychological resilience. This strategy provides the technical foundation, but consistent application under pressure separates winners from participants. Master the system, trust the process, and let probability work in your favor over the competition timeline.
repost-content-media
  • Reward
  • Comment
  • Repost
  • Share
#WeekendCryptoHoldingGuide
Gate Square | #假期持币指南 — HighAmbition's Complete Holiday Trading Discussion
A full, honest, step-by-step breakdown of every question Gate asked — plus a deep analytical dive on my two favorite coins: XAUT and GT. Written for the Qingming Holiday 2026 activity.
Opening Thoughts
Spring is here. The mountains are calling. The K-line is also calling — louder, honestly. But here is what separates a serious trader from someone who just calls themselves a trader: the serious one builds a system that works whether they are watching or not. That is the entire philosophy behin
XAUT0,08%
GT-0,54%
HighAmbition
#WeekendCryptoHoldingGuide
Gate Square | #假期持币指南 — HighAmbition's Complete Holiday Trading Discussion
A full, honest, step-by-step breakdown of every question Gate asked — plus a deep analytical dive on my two favorite coins: XAUT and GT. Written for the Qingming Holiday 2026 activity.
Opening Thoughts
Spring is here. The mountains are calling. The K-line is also calling — louder, honestly. But here is what separates a serious trader from someone who just calls themselves a trader: the serious one builds a system that works whether they are watching or not. That is the entire philosophy behind how I trade, how I hold through holidays, and why I chose XAUT and GT as my two core positions. Everything below is real — my actual approach, my actual reasoning, no fluff.
Holiday Mindset
My answer is neither extreme. Going completely offline during a holiday sounds peaceful, but crypto never sleeps. The Qingming holiday in China pauses traditional markets, but crypto continues running 24/7, reacting instantly to global macro triggers like oil shocks, Federal Reserve signals, geopolitical escalations, and tariff announcements. If you hold XAUT, which is tied directly to gold, ignoring the market completely is not an option because gold reacts immediately to these macro events.
On the other side, checking the market every 30 minutes is equally dangerous. It destroys mental clarity, ruins your holiday experience, and leads to emotional decisions. A red candle triggers panic selling, a green candle triggers impulsive buying, and both usually result in losses, especially during holidays when liquidity is thinner and spreads are wider.
My approach is structured awareness with pre-set automation. Before the holiday starts, I spend around 25 minutes setting price alerts for every asset I hold. For XAUT, alerts are placed at $4,620 on the downside and $4,660 on the upside. For GT, alerts are set at $6.20 and $6.70. Then I ensure every open position has a stop-loss in place, because risk control is non-negotiable.
I define two check windows only — one quick glance in the morning at 08:30 local time, and one structured review at 21:00 where I look at macro headlines and system performance. Outside of those windows, I disconnect completely and trust the system. That trust is the real edge.
Lazy Person’s Secret
The real advantage during holidays comes from automation. My system runs on three layers simultaneously, each designed to remove emotion and maintain efficiency.
The first layer is weekly DCA into GT. A fixed USDT amount buys GT every week regardless of price. GT has already declined around 39% over the past 90 days, so this strategy allows accumulation at lower average prices without trying to time the bottom. If GT trades at $6.50 one week and $6.20 the next, the average entry naturally improves. Over time, this creates a strong position built through consistency rather than prediction.
The second layer is a grid trading bot on XAUT/USDT. XAUT trades at $4,636, with a 24-hour range between $4,631.7 and $4,645.8. This tight movement creates ideal conditions for grid trading. By setting a range between $4,600 and $4,680 with 10 grid levels, the bot automatically buys on dips and sells on rises, capturing small profits repeatedly. Because XAUT follows gold, its movement is more structured and less chaotic than typical altcoins, making it ideal for this strategy.
The third layer is Simple Earn on idle USDT. Any unused capital is placed into flexible yield products, generating daily returns instead of sitting idle. Even during a short holiday period, this ensures that all capital remains productive.
All of this preparation takes about 25 minutes before the holiday begins. After that, the system runs independently while I focus on real life.
April Outlook
My focus remains on XAUT and GT, both chosen based on clear reasoning rather than speculation.
XAUT Deep Analysis
XAUT represents tokenized gold, backed 1:1 by physical reserves stored in Switzerland under LBMA standards. It is not a speculative asset but a digital representation of real gold, combining stability with blockchain flexibility.
Currently, XAUT is trading at $4,636 USDT, with a 24-hour range between $4,631.7 and $4,645.8. It has gained +2.88% over the last 7 days, declined -9.87% over 30 days, and still holds a +3.26% gain over 90 days. Its market cap stands at -$2.59 billion with a rank of #38, and social sentiment remains strongly positive at 83%.
From a technical perspective, the short-term structure shows recovery signs, while the medium-term trend remains cautious due to the prior correction. This creates a setup where short-term strength meets longer-term opportunity. A nearly 10% correction in a gold-backed asset during global instability is not weakness — it is positioning opportunity.
The macro case strengthens this view. Rising geopolitical tensions, particularly around the Strait of Hormuz, create inflation fears and drive capital into safe-haven assets like gold. At the same time, equity market weakness pushes institutional money toward defensive positions. If the dollar weakens due to potential monetary easing, gold benefits further.
Additionally, ecosystem expansion has increased XAUT utility, with new collateral options, trading pairs, and derivatives products being introduced. This increases accessibility and demand within the crypto ecosystem.
My strategy is to hold XAUT as a macro hedge while running a grid bot within the $4,600—$4,680 range. The upside target remains $4,700+, while risk is controlled with a stop-loss below $4,610.
GT Deep Analysis
GT functions as the native token of the Gate ecosystem, effectively acting as a form of platform equity. Its value is tied directly to platform growth, user expansion, and ecosystem development.
GT is currently trading at $6.50 USDT, with a 24-hour change of +0.61% and a range between $6.39 and $6.51. Volume has surged to -369,000 USDT compared to a 7-day average of -68,300 USDT, representing a 5.4x spike. Meanwhile, price has declined -0.76% over 7 days, -6.88% over 30 days, and -38.79% over 90 days, placing it at rank #89.
The most important observation is the volume spike. A 5.4x increase in volume with stable price movement indicates accumulation rather than selling. This suggests that larger players are positioning quietly.
Short-term technical structure shows bullish momentum, while higher timeframes still reflect prior bearish pressure. However, early signs of trend exhaustion are visible, especially with improving structure and strong volume support.
Fundamentally, GT benefits from continuous ecosystem growth, including trading fee discounts, Launchpool access, and participation in platform campaigns. The ongoing Gate x Red Bull F1 tournament is driving user engagement, increasing trading activity, and expanding brand exposure.
My strategy involves consistent DCA accumulation, fee optimization through GT holdings, and participation in ecosystem rewards. The upside target remains in the $7.50—$8.00 range, while risk is managed through proper position sizing.
Final Philosophy
Everything comes down to one principle: systems beat willpower. Emotional decisions destroy portfolios, while structured systems create consistency. By automating DCA, grid trading, and yield generation, I remove emotional interference and allow the system to operate efficiently.
During this Qingming holiday, my portfolio continues working through automated strategies while I step away. XAUT provides macro protection and stability, while GT offers growth potential tied to platform expansion.
The market continues moving regardless of holidays. The goal is not to control the market, but to build a system that works without constant attention.
The spring light is here. I am outside.
But the system is still running.
repost-content-media
  • Reward
  • Comment
  • Repost
  • Share
#GateSquareAprilPostingChallenge
1 — The Big Picture: Why These Three Assets Are Now One System
April 2026 is not a typical market environment. What we are witnessing is a macro convergence, where Bitcoin, Crude Oil, and Gold are no longer trading independently — they are reacting to the same global force:
Geopolitical instability.
The ongoing tensions involving United States–Iran conflict dynamics, disruptions in the Strait of Hormuz, and attacks in the Red Sea have created a chain reaction across all markets.
The Core Relationship:
Oil drives inflation
Gold reflects fear
Bitcoin reacts to l
BTC-0,67%
XAUT0,08%
HighAmbition
#GateSquareAprilPostingChallenge
1 — The Big Picture: Why These Three Assets Are Now One System
April 2026 is not a typical market environment. What we are witnessing is a macro convergence, where Bitcoin, Crude Oil, and Gold are no longer trading independently — they are reacting to the same global force:
Geopolitical instability.
The ongoing tensions involving United States–Iran conflict dynamics, disruptions in the Strait of Hormuz, and attacks in the Red Sea have created a chain reaction across all markets.
The Core Relationship:
Oil drives inflation
Gold reflects fear
Bitcoin reacts to liquidity
Understanding today’s market means understanding how these three interact as a system, not as separate trades.
2 — Crude Oil (XTI): The Primary Driver of Everything
Right now, oil is the starting point of the entire macro chain.
With XTI trading around the $105 range, markets are pricing in serious supply disruption risk, mainly due to instability near the Strait of Hormuz — a route responsible for nearly 20% of global oil flows.
Step-by-Step Impact:
1. Supply Shock Risk
Any escalation involving Iran threatens global oil supply. Even the fear of disruption pushes prices higher.
2. Inflation Transmission
Higher oil prices increase:
Transport costs
Manufacturing costs
Energy bills globally
This directly pushes inflation higher, especially in economies like the United States.
3. Central Bank Constraint
When inflation rises, the Federal Reserve cannot ease policy easily.
Result: Interest rates stay high → liquidity tightens
4. Liquidity Shock to Risk Assets
When liquidity contracts:
Crypto markets weaken
Equities struggle
Investors move to safer assets
Scenario Mapping:
$105 Oil → Uncertainty, sideways crypto
$110–$120 Oil → Strong risk-off pressure
$120+ Oil → Panic environment, aggressive capital rotation into gold
👉 Key Insight:
Oil is not just another asset — it is the trigger variable controlling global liquidity in April 2026.
3 — Gold (XAUT): The Market’s Fear Gauge
Gold is currently behaving exactly as expected in a geopolitical crisis — strong, bid, and heavily accumulated.
With XAUT near $4,637 and bullish sentiment above 80%, the market is clearly positioning for continued instability.
Why Gold Is Rising:
1. Safe Haven Demand
During conflict, institutions reduce exposure to volatile assets and rotate into gold. This is a decades-proven behavior.
2. Currency Dynamics
If inflation rises but central banks hesitate to tighten further, the US dollar weakens — which boosts gold prices (since gold is USD-denominated).
3. Strategic Positioning
Large funds are not just hedging — they are positioning for prolonged uncertainty.
4. Structural Shift in Crypto Platforms
Platforms like Gate.io introducing XAUT and oil derivatives shows something deeper:
👉 Macro assets are becoming part of crypto-native trading ecosystems
Technical Insight:
Gold is currently in a short-term bullish structure within a broader consolidation phase:
Higher timeframe shows exhaustion after strong Q1 rally
Lower timeframes show continued buying pressure
Forward Outlook:
If tensions escalate → $5,000 becomes realistic
If tensions ease → expect sharp profit-taking
👉 Key Insight:
Gold is already pricing in risk that crypto has not fully reacted to yet.
4 — Bitcoin (BTC): Stuck Between Two Identities
Bitcoin is currently in a conflicted state.
It is trying to evolve into “digital gold” — but in reality, it still behaves like a high-risk tech asset.
What’s Happening:
1. Strong Correlation With Tech Markets
BTC maintains high correlation with equity indices like the Nasdaq-100, especially during macro shocks.
👉 When oil rises → inflation fears rise → tech sells off → BTC follows.
2. Liquidity Sensitivity
Bitcoin is extremely sensitive to global liquidity:
Tight liquidity → BTC drops
Easy liquidity → BTC rallies
3. De-Risking Behavior
In crisis moments:
Investors sell liquid assets first
BTC becomes a source of quick liquidity
4. Institutional Transition Phase
Despite short-term weakness, long-term fundamentals are improving:
Charles Schwab planning crypto trading
Corporate accumulation continues
Infrastructure is expanding
Technical Position:
Bearish structure on higher timeframe
Early reversal signals forming (divergence, SAR flips)
Key levels:
Support: $66,700
Resistance: $67,500–$68,000
👉 Key Insight:
BTC is not failing — it is reacting exactly as a liquidity-driven asset should in a macro tightening environment.
5 — The Transmission Mechanism (The Real Market Engine)
Everything connects through a simple but powerful chain:
Geopolitical Conflict

Oil Prices Rise (XTI)

Inflation Increases

Federal Reserve Stays Tight

Liquidity Contracts

Bitcoin Weakens (Short-Term)
Meanwhile:
Same Conflict

Safe Haven Demand

Gold (XAUT) Rises
6 — What Traders Must Watch (Critical Signals)
Focus on these real-time triggers:
Developments near the Strait of Hormuz
Federal Reserve policy tone
Oil breaking above key levels ($110, $120)
Gold momentum continuation or reversal
Correlation breakdown between BTC and equities
7 — Final Conclusion: The Real Insight for April 2026
This market is no longer about isolated charts — it is about macro reactions.
Oil controls inflation and liquidity
Gold reflects fear and capital preservation
Bitcoin reacts to liquidity cycles while building long-term strength
👉 The most important shift:
Crypto is now fully integrated into the global macro system.
Every headline involving Iran, every move by the Federal Reserve, and every spike in oil is directly influencing BTC price action.
Final Trading Insight
This is not a trend market — it is a reaction market.
Watch oil as your leading indicator
Use gold as your risk sentiment gauge
Treat BTC as a liquidity-sensitive instrument
repost-content-media
  • Reward
  • Comment
  • Repost
  • Share
#CryptoMarketSeesVolatility
What Is Crypto Market Volatility?
Volatility means the rapid and unpredictable movement of asset prices — up or down — within a short timeframe. In the crypto market, this is not a rare event. It is the defining characteristic. Understanding WHY it happens and HOW it affects Bitcoin and Ethereum specifically is the foundation of being a better-informed participant in this space.
---
Part 1 — The Fear & Greed Index: The Pulse of the Market
Before diving into individual coins, you must understand the overall market mood. Right now, the Crypto Fear & Greed Index sits
HighAmbition
#CryptoMarketSeesVolatility
What Is Crypto Market Volatility?
Volatility means the rapid and unpredictable movement of asset prices — up or down — within a short timeframe. In the crypto market, this is not a rare event. It is the defining characteristic. Understanding WHY it happens and HOW it affects Bitcoin and Ethereum specifically is the foundation of being a better-informed participant in this space.
---
Part 1 — The Fear & Greed Index: The Pulse of the Market
Before diving into individual coins, you must understand the overall market mood. Right now, the Crypto Fear & Greed Index sits at 12 out of 100, which is classified as Extreme Fear.
This single number tells a very important story:
When fear dominates, retail investors panic-sell
Weak hands exit positions, forcing prices lower
Institutional players often use these exact moments to accumulate
Historically, extreme fear has preceded major recovery phases
This is the environment BTC and ETH are currently operating in.
---
Part 2 — Bitcoin (BTC): The Institutional Battle Zone
Current Price: $67,181 USDT
24-Hour Range: $66,848 — $67,547
24-Hour Change: +0.48%
24-Hour Volume: Over $216 million
What Is Driving BTC Volatility Right Now?
Bullish Forces Pushing Price Up:
1. Institutional Accumulation at Scale — Strategy (formerly MicroStrategy) purchased 44,000 BTC through its preferred stock program. This is not a speculative trade. This is a long-term conviction bet worth billions of dollars.
2. BlackRock and Charles Schwab Entering Spot Trading — When trillion-dollar traditional finance giants build infrastructure for BTC spot trading, it permanently changes the demand structure of the asset. Supply stays capped at 21 million. Demand channels are multiplying.
3. Bitcoin ETF vs. Gold ETF Race — Bitcoin ETFs are approaching the asset size of Gold ETFs. This is a historic milestone. It signals that institutional allocation to BTC is no longer experimental — it is becoming standard portfolio practice.
4. Innovation Validating the Thesis — At the BOSS Summit, Mesh Radio demonstrated Bitcoin transactions with zero internet connectivity. This reinforces BTC's core identity as uncensorable, unseizable money — a narrative that attracts capital during periods of geopolitical uncertainty.
5. Jack Dorsey Reviving the Bitcoin Faucet — A symbolic but meaningful signal. Grassroots adoption efforts being revived by a high-profile figure keeps BTC in public conversation.
Bearish Forces Pushing Price Down:
1. Geopolitical Tensions — Global instability is pushing oil prices above $103 per barrel. When macro uncertainty rises, risk assets across all categories — stocks, crypto, commodities — face selling pressure as investors move toward perceived safe havens.
2. Derivatives Market Dominated by Short Sellers — In the futures and options market, short positions currently outnumber long positions. This creates downward price pressure and raises the risk of long liquidations if prices dip below key support levels.
3. Retail Stop-Loss Cascade Risk — Many retail traders set automatic stop-losses at round numbers like $65,000 or $64,000. If price touches those levels, automated selling triggers — amplifying the move downward dramatically.
BTC Market Sentiment on Social Media
Bullish voices: 83 unique accounts, 183 posts
Bearish voices: 41 unique accounts, 65 posts
Total engaged accounts: 144
The bullish-to-bearish ratio is roughly 2:1. Despite extreme fear in the overall index, BTC has a relatively resilient social sentiment — more people are defending the bull case than attacking it.
---
Part 3 — Ethereum (ETH): The Infrastructure Under Pressure
Current Price: $2,057.45 USDT
24-Hour Range: $2,044 — $2,083
24-Hour Change: +0.33%
24-Hour Volume: Over $116 million
What Is Driving ETH Volatility Right Now?
Bullish Forces:
1. First Net Buying in Derivatives Since 2023 — This is a technically significant signal. ETH derivatives markets recorded $104 million in net buying — the first positive net position since 2023. This suggests institutional and professional traders are beginning to build long exposure, which typically precedes a price recovery.
2. Bitmine Continuously Accumulating ETH — Bitmine has now added 40,000 ETH to its treasury, worth over $82 million. Sustained corporate buying reduces the circulating supply available on exchanges — a structurally bullish development.
3. Charles Schwab Launching ETH Spot Trading — Similar to what is happening with BTC, ETH is gaining new institutional on-ramps. When traditional brokerage accounts can hold ETH directly, a massive new pool of capital becomes accessible.
4. $80 Trillion in On-Chain Stablecoin Transfers Per Quarter — This number is the most underrated ETH metric. The Ethereum network processes $80 trillion in stablecoin value every quarter. This is the actual economic output of the network — and it is larger than the GDP of most countries. ETH as infrastructure is not theoretical. It is producing real economic utility at scale.
Bearish Forces:
1. ETF Net Outflows of $42.1 Million — While some institutions are buying directly (Bitmine), ETH ETFs saw $42.1 million in net outflows. This shows that institutional sentiment is divided — some are accumulating, others are reducing exposure. This split creates uncertainty and price instability.
2. Global Liquidity Contraction — When central banks tighten monetary policy and oil prices rise, the total amount of money flowing into risk assets shrinks. ETH, being a risk asset, suffers disproportionately compared to BTC, which has stronger "digital gold" narrative protection.
3. Macro Pressure Is Heavier on ETH Than BTC — In risk-off environments, capital tends to rotate from altcoins and smart contract platforms toward Bitcoin first. ETH typically underperforms BTC during periods of extreme fear — exactly the environment we are in right now.
ETH Market Sentiment on Social Media
Bullish voices: 26 unique accounts, 35 posts
Bearish voices: 16 unique accounts, 21 posts
Total engaged accounts: 60
ETH sentiment is noticeably quieter than BTC. Engagement volume is lower, and while bulls still outnumber bears, the margin is tighter. This reflects the current reality — ETH is in a consolidation phase with less conviction on either side.
---
Part 4 — The 5 Core Causes of Crypto Volatility (Applied to This Moment)
Cause How It Affects BTC Right Now How It Affects ETH Right Now
Macro Events Oil at $103 creates risk-off pressure Heavier impact — ETH seen as higher risk than BTC
Institutional Flows Net positive — Strategy, BlackRock building Mixed — Bitmine buying, ETF outflows offsetting
Derivatives & Leverage Shorts dominant, liquidation risk is real First net buying since 2023 — potential turning point
Regulatory Clarity ETF approvals building confidence ETF product expansion starting
Social Sentiment 2:1 bullish-to-bearish ratio Quieter, closer to neutral
---
Part 5 — What Does This All Mean Practically?
For BTC:
The market is caught between institutional buyers who see long-term value and short-term traders who are fearful. The $66,800 — $67,500 range is a short-term equilibrium zone. A break above $67,600 with volume could signal short-term momentum. A drop below $66,800 risks triggering stop-loss cascades.
For ETH:
The $2,044 support level has held so far. The first net derivatives buying since 2023 is a meaningful technical signal. However, macro headwinds and ETF outflows create a ceiling. Watch the $2,100 level — if ETH can reclaim and hold above it with volume, sentiment may shift.
For the Overall Market:
A Fear & Greed Index of 12 is historically uncommon. The last time this index was this low, it preceded significant recoveries — but timing the exact bottom is impossible. What it does tell you clearly is that the market is in capitulation territory, not euphoria territory. Risk-reward, from a long-term perspective, tends to favor buyers at extreme fear readings more than at extreme greed readings.
---
Final Summary
The hashtag #CryptoMarketSeesVolatility is not just a trending phrase. It captures a real, multi-layered moment where institutional money is moving in, macro fear is pushing retail out, and both BTC and ETH are caught in a tug-of-war between long-term structural strength and short-term macro pressure. Volatility is not the enemy — confusion about what is causing it is
repost-content-media
  • Reward
  • Comment
  • Repost
  • Share
  • Pin