April has started with a familiar path across the crypto market as prices attempt to stabilize after a volatile March. The last month delivered bearish moves for many assets, which would make crypto holders wonder what might happen in April.
Kaspa, XRP, and Cardano all show a similar structure at the start of the new month. Short-term rebounds have appeared, yet broader pressure has not fully cleared. That mix creates a market where price can move in tight ranges before a stronger move develops.
-
Kaspa Price Outlook Shows Recovery Attempt Inside A Wider Pullback Structure
- Kaspa Price Prediction For Today Points To Sideways Movement With Mild Upside Bias
-
XRP Price Holds Near Support As Market Searches For Direction
- XRP Price Prediction For Today Suggests Range-Bound Movement Near Support
-
Cardano Price Attempts Recovery, But Broader Trend Remains Weak
- Cardano Price Prediction For Today Points To Consolidation With Mild Bounce Potential
Kaspa Price Outlook Shows Recovery Attempt Inside A Wider Pullback Structure
Kaspa still holds a positive 30-day performance of about 10%, which keeps the medium term structure intact. The last 7 days show a 10% decline, which confirms a clear pullback from March highs. The latest 24-hour move of 2.91% shows a bounce, yet it remains limited in strength.
This combination shows that Kaspa has not fully lost its upward structure, but short-term pressure remains visible.
| Metric |
| Value |
| — |
| Price |
| $0.0328 |
| 24h Change |
| +2.91% |
| 7d Change |
| −10.16% |
| 30d Change |
| +10.58% |
| RSI (14) |
| 46.15 |
| 7 Day SMA |
| $0.03447 |
| 30 Day SMA |
| $0.03315 |
| MACD Line |
| 0.00034 |
| MACD Signal |
| 0.00087 |
| MACD Histogram |
| −0.00053 |
RSI near 46 places Kaspa in a neutral zone that leans slightly bearish. This level does not show exhaustion on either side, which means price can still move in either direction.
Price trading below both the 7-day and 30-day SMAs confirms that the short term trend remains under pressure. MACD stays below its signal line, and the histogram remains negative, though the size is small. That combination points to weak downward momentum without strong selling pressure.
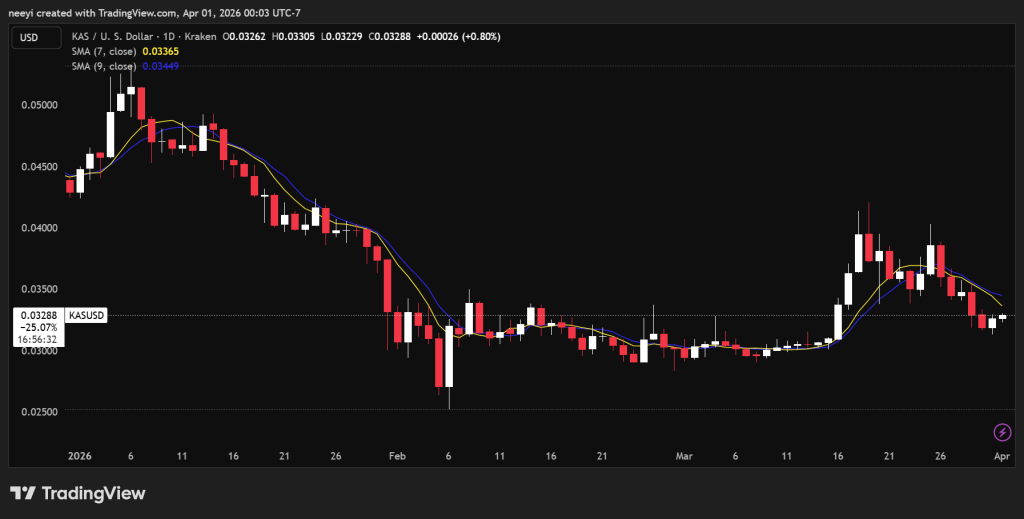
Kaspa has a recent swing high at $0.04172 and a swing low at $0.02907. Fibonacci levels place resistance near $0.0339 and support around $0.0318. Current price sits between those levels, which shows a deep retracement zone.
Kaspa Price Prediction For Today Points To Sideways Movement With Mild Upside Bias
As long as $0.0318 holds, price can move between $0.0318 and $0.0354 as indicators flatten. A move above $0.0339 could push price toward $0.035 to $0.038. A break below $0.0318 would open room toward $0.029.
The current structure leans slightly bullish for today, though upside remains limited without stronger volume.
XRP Price Holds Near Support As Market Searches For Direction
XRP has remained almost flat over the last 30 days with only a slight gain. The last 7 days show a 4.50% drop, which confirms a pullback. The 24-hour move of 2.58% shows a bounce, yet it does not confirm a trend reversal.
That pattern shows that XRP has entered a consolidation phase near key support.
| Metric |
| Value |
| — |
| Price |
| $1.36 |
| 24h Change |
| +2.58% |
| 7d Change |
| −4.50% |
| 30d Change |
| +0.02% |
| RSI (14) |
| 41.66 |
| 7 Day SMA |
| $1.35 |
| 30 Day SMA |
| $1.40 |
| MACD Line |
| −0.02635 |
| MACD Signal |
| −0.01724 |
| MACD Histogram |
| −0.00912 |
RSI sits near 42, which shows weak momentum without reaching oversold levels. Price trading around the 7-day SMA shows short-term stabilization. Price remains below the 30-day SMA, which keeps the broader structure under pressure.
MACD remains negative and below the signal line. The histogram also shows clear bearish momentum, which confirms that sellers still have influence.
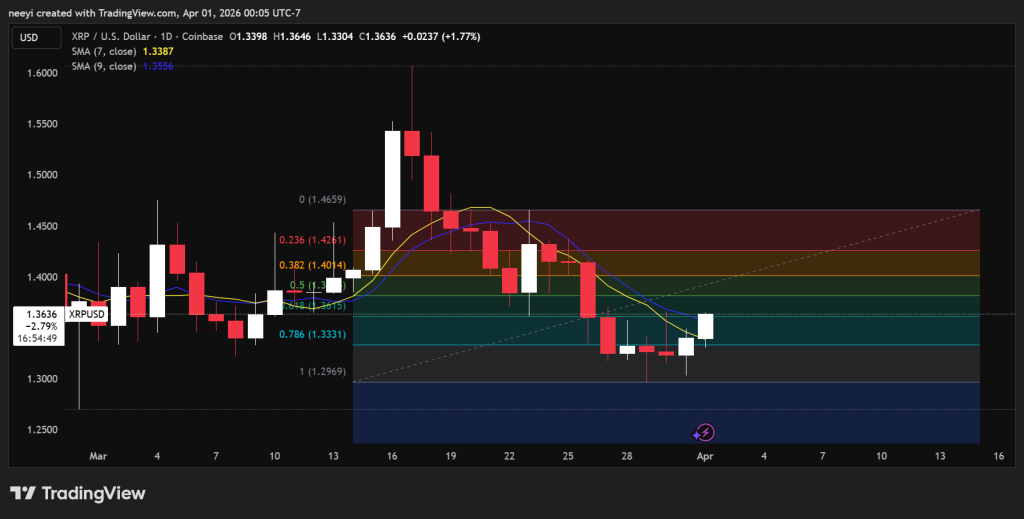
XRP has a swing high at $1.60 and a swing low at $1.30. Fibonacci levels place resistance near $1.37 and $1.42. Current price near $1.35 shows that XRP is close to support and still inside a deep retracement zone.
XRP Price Prediction For Today Suggests Range-Bound Movement Near Support
As long as $1.30 holds, price may move between $1.30 and $1.42. A push above $1.37 could test $1.42 to $1.45. A break below $1.30 would weaken the structure and could extend losses.
Current indicators point toward a choppy session near support unless a strong catalyst appears.
Cardano Price Attempts Recovery, But Broader Trend Remains Weak
Cardano has posted a 6.96% loss over the last 30 days and a 5.89% drop over the last 7 days. This confirms a steady downward structure. The latest 24 hour gain of 3.53% shows a bounce after that decline.
This setup places Cardano in a recovery attempt inside a broader downtrend.
| Metric |
| Value |
| — |
| Price |
| $0.251 |
| 24h Change |
| +3.53% |
| 7d Change |
| −5.89% |
| 30d Change |
| −6.96% |
| RSI (14) |
| 38.98 |
| 7 Day SMA |
| $0.24873 |
| 30 Day SMA |
| $0.26180 |
| MACD Line |
| −0.00795 |
| MACD Signal |
| −0.00590 |
| MACD Histogram |
| −0.00205 |
RSI near 45 shows that Cardano is close to bearish conditions. This supports the recent bounce. Price moving slightly above the 7-day SMA shows short-term strength. Price still remains below the 30-day SMA, which keeps the broader trend weak.
MACD remains negative, though the histogram shows reduced downside pressure. That signals that selling momentum may be slowing.
Cardano has a swing high at $0.29413 and a swing low at $0.23468. Fibonacci levels place resistance near $0.257 and support around $0.247. Current price near $0.2529 sits inside this range.
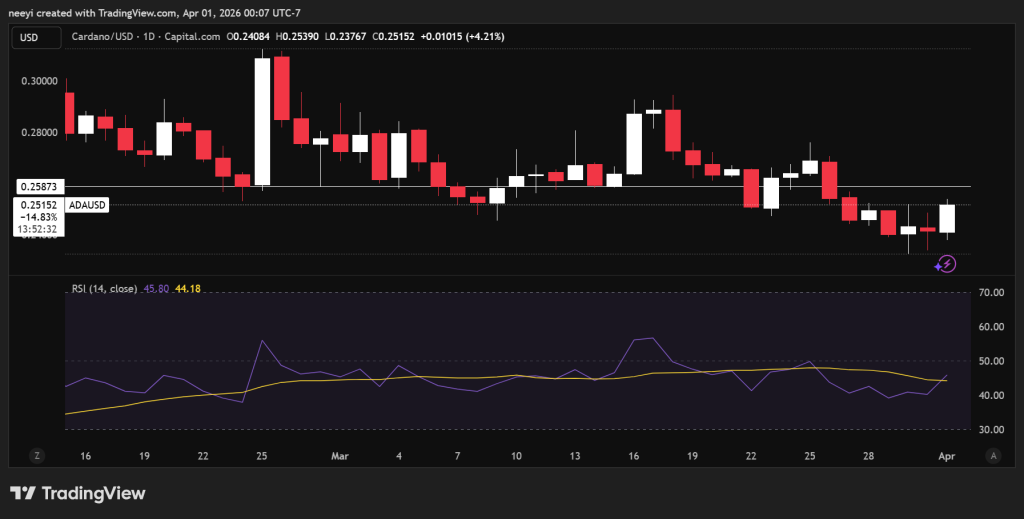
Cardano Price Prediction For Today Points To Consolidation With Mild Bounce Potential
If $0.247 holds, price may move between $0.247 and $0.264. A move above $0.257 to $0.264 could open room toward $0.28. A drop below $0.247 would bring $0.234 back into focus.
The structure shows a cautious recovery attempt, though the broader trend remains weak until higher resistance levels are reclaimed.
Crypto markets often take time to decide direction at the start of a new month. Kaspa, XRP, and Cardano now sit near levels that could define their next move.
Disclaimer: The information on this page may come from third parties and does not represent the views or opinions of Gate. The content displayed on this page is for reference only and does not constitute any financial, investment, or legal advice. Gate does not guarantee the accuracy or completeness of the information and shall not be liable for any losses arising from the use of this information. Virtual asset investments carry high risks and are subject to significant price volatility. You may lose all of your invested principal. Please fully understand the relevant risks and make prudent decisions based on your own financial situation and risk tolerance. For details, please refer to
Disclaimer.
