Key Takeaways
-
OriginTrail (TRAC) has surged around 12% in a single day, drawing renewed attention to the token.
-
TRAC has broken out from an ascending triangle near $0.46 on the daily chart, signaling growing bullish momentum.
-
Similar breakout structures in July and October 2025 previously led to strong rallies of 63% and 113%.
-
Holding the $0.44–$0.46 zone as support will be crucial to keep the bullish fractal setup intact.
-
If the pattern plays out, TRAC could attempt a move toward its long-term ascending resistance above $1.00.
OriginTrail, the decentralized knowledge graph protocol, is stepping back into the spotlight as its native token TRAC records a strong 12% daily surge. Beyond the price jump, the real signal is coming from the charts, where a familiar fractal breakout structure is starting to emerge on the daily timeframe, hinting that a larger upside move could be forming.
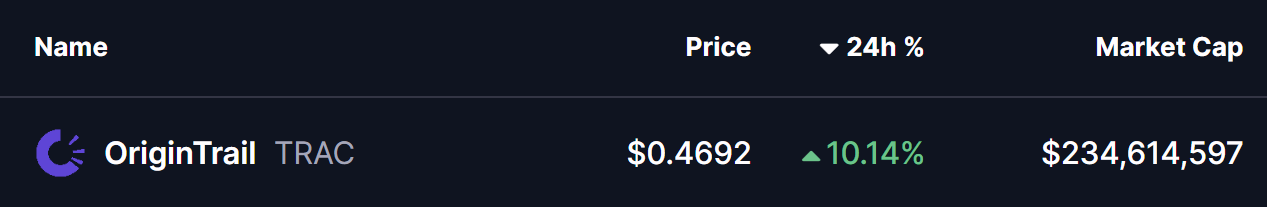
Source: Coinmarketcap
Fractal Breakout Hints at Potential Upside Move
On the daily chart, TRAC has confirmed a breakout from an ascending triangle pattern near the $0.46 level. This breakout is particularly important as price is now trading just above the 200-day moving average, a level that has historically acted as a major trend-defining zone for TRAC.
What makes this setup more compelling is its similarity to previous breakout phases. In late July 2025, a comparable structure resulted in a 63% upside move after price held above its breakout base. Later, in early October 2025, TRAC broke out from a right-angled descending broadening wedge pattern. That move was followed by a reclaim of the 200-day moving average and ultimately led to a powerful 113% rally.

OriginTrail (TRAC) Daily Chart/Coinsprobe (Source: Tradingview)
The current setup shares key characteristics with those earlier moves. Price compression, a clean breakout, and interaction with the 200-day MA suggest that TRAC may once again be transitioning from consolidation into expansion.
What’s Next for TRAC?
If this fractal breakout plays out as expected, holding the $0.44–$0.46 zone as support will be crucial. A sustained hold above this range, along with continued strength above the 200-day moving average, could act as a launchpad for further upside.
In that scenario, TRAC may attempt a move toward its long-term ascending resistance trendline, which currently sits above the $1.00 level. A push toward that zone would align closely with the magnitude of prior fractal-driven rallies seen on the chart.
That said, fractal patterns are never guarantees. Broader market conditions, liquidity, and overall sentiment will continue to influence price action. A failure to hold the $0.44–$0.46 support zone or a rejection back below the 200-day moving average could invalidate the breakout and weaken the bullish fractal thesis.
Bottom Line
TRAC is showing early signs of another technically significant breakout, supported by historical fractal behavior and a reclaim of a key long-term moving average. If buyers can defend the current support zone, the chart suggests that OriginTrail may be positioning itself for a larger upside move in the weeks ahead.
Disclaimer: The views and analysis presented in this article are for informational purposes only and reflect the author’s perspective, not financial advice. Technical patterns and indicators discussed are subject to market volatility and may or may not yield the anticipated results. Investors are advised to exercise caution, conduct independent research, and make decisions aligned with their individual risk tolerance.
About Author: Nilesh Hembade is the Founder and Lead Author of Coinsprobe, with over 5 years of experience in the cryptocurrency and blockchain industry. Since launching Coinsprobe in 2023, he has been providing daily, research-driven insights through in-depth market analysis, on-chain data, and technical research.
Disclaimer: The information on this page may come from third parties and does not represent the views or opinions of Gate. The content displayed on this page is for reference only and does not constitute any financial, investment, or legal advice. Gate does not guarantee the accuracy or completeness of the information and shall not be liable for any losses arising from the use of this information. Virtual asset investments carry high risks and are subject to significant price volatility. You may lose all of your invested principal. Please fully understand the relevant risks and make prudent decisions based on your own financial situation and risk tolerance. For details, please refer to
Disclaimer.
Gerelateerde artikelen
$LINK and $PIPPIN Outshine AI Agent Projects By Social Activity
The article discusses the Top 10 AI Agent Projects in cryptocurrency based on social activity, revealing Chainlink ($LINK) as the leader. It highlights engagement and interaction metrics for various projects, indicating strong interest and demand in the market.
BlockChainReporter2u geleden
Ethereum Network Activity Claims New ATH Indicating Bullish Divergence
The Ethereum network has reached a new all-time high in activity, signaling its growing utility beyond speculation. Factors like L2 scaling and DeFi are driving this surge, suggesting strong long-term growth potential for Ethereum ($ETH).
BlockChainReporter2u geleden
FLOW Recovers From Prolonged Downtrend As Buy-Side Liquidity Builds, Triggering a Potental 22% Br...
The Flow (FLOW) coin is attracting investor interest as its on-chain market continues to pick up fresh momentum, according to a revelation disclosed today by financial analyst Crypto Patel. As per the data posted today, the cryptocurrency has developed a clear bull structure and is displaying a
BlockChainReporter2u geleden
PEPE Price Holds Support as Bearish Bets Build Pressure
Key Insights:
PEPE price stabilizes near strong support despite sustained negative funding rates, highlighting a clear divergence between trader sentiment and actual market behavior.
Declining open interest and reduced liquidation activity indicate leverage reset, suggesting the market has c
CryptoNewsLand3u geleden
Zcash Price Rally Gains Pace as Shielded Pools Hit Record
Key Insights:
Zcash surged 25% daily and over 60% monthly as strong demand for privacy features drove increased investor participation across the network.
Shielded pool holdings reached $5.18 billion, showing over 31% of supply now locked in private transactions, signaling stronger user
CryptoNewsLand3u geleden
'Bitcoin ETF Performance Pales Next to Gold': Mike McGlone - U.Today
Mike McGlone, a Bloomberg strategist, argues that Bitcoin ETFs may not drive long-term growth for Bitcoin, which has underperformed compared to gold. Despite recent gains, Bitcoin's performance seems capped, suggesting a potential peak in crypto enthusiasm.
UToday4u geleden
