Bitcoin Price Crash to $39K? This Bear Market Bottom Metric Says the Pain Isn’t Over

Bitcoin is trading around $68K right now, but a CryptoQuant chart making the rounds is putting a much lower number back on the table: $39K. The logic comes from one of the most watched on-chain “line in the sand” metrics in crypto cycles — realized price.
- What the BTC chart is showing
- What “realized price” means in plain English
- How realistic is $55K… and the $39K flush?
- The levels that matter from here
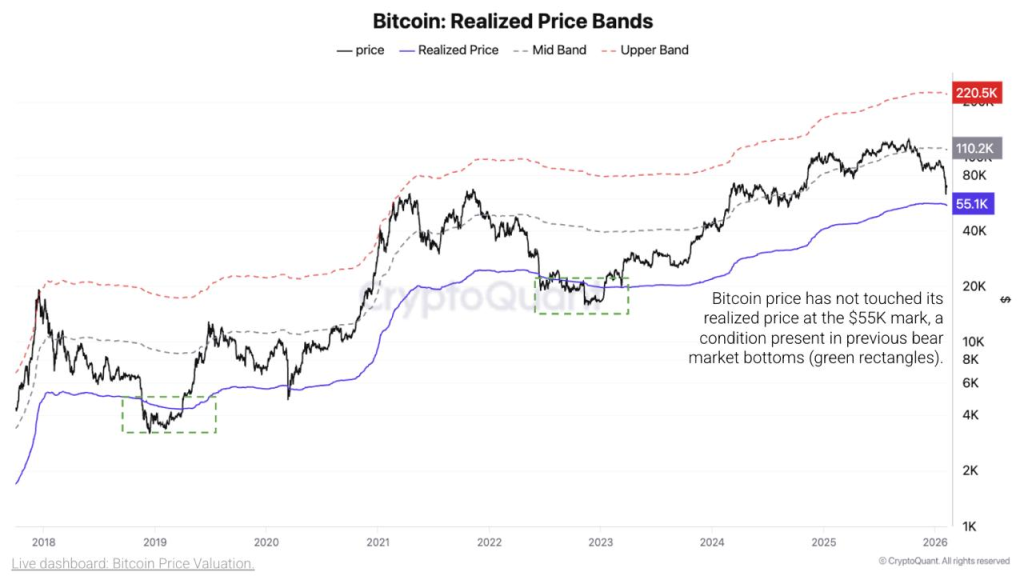
What the BTC chart is showing
The chart plots Bitcoin’s market price (black) against realized price (blue), plus a set of bands above it. On the right side, the realized price level sits near $55.1K.
The key observation: in prior bear market bottoms, Bitcoin didn’t bottom until price came down to realized price (the green-highlighted zones on older cycles). In the current cycle, price has not tagged that realized-price line yet.
Those dashed bands matter for context, too. They act like valuation zones across cycles:
- The realized price acts like a “cost basis anchor” for the market.
- The higher bands map out hotter valuation zones that usually show up in full-risk-on phases.
Source: X/@coinbureau
What “realized price” means in plain English
Realized price is basically Bitcoin’s average** on-chain cost basis**: it values each coin at the last price it moved on-chain, then averages that across the supply. Put simply, it estimates what the market, as a whole, paid for its BTC.
Why traders care: when Bitcoin trades above realized price, the average holder is in profit. When it trades at or below realized price, the market is under stress and capitulation dynamics show up more often.
It’s not a magic bottom button, but it’s one of the cleaner “where does pain peak” gauges that tends to matter most during deep drawdowns.
How realistic is $55K… and the $39K flush?
From $68K to $55K is a drop of about 19%. That’s completely plausible in crypto terms, especially during a volatility spike or a broader risk-off move.
The more extreme number comes from the historical note baked into the post: in past cycles, Bitcoin pushed 24–30% below it before the final low printed.
If realized price is ~$55K:
- 24% below is about $41.8K
- 30% below is about $38.5K
That’s where the $39K headline comes from. It’s basically a “full capitulation” scenario where the market overshoots the average cost basis before stabilizing.
The reality check: a drop to $39K would require a much more aggressive unwind than a normal pullback. It would likely need a sharp liquidity event, a macro shock, or a broad deleveraging wave that forces sellers to dump into a thin bid.
Read also: AI is Coming For Your Stocks – Here’s What You Need to Know
The levels that matter from here
If this realized-price framework is the lens, then the map is straightforward:
- $68K (current area): market still holding above the “pain line,” but not far enough to dismiss a deeper reset.
- $60K: a psychological and structural zone that tends to get defended first.
- $55K (realized price): the key level CryptoQuant is flagging as the classic bear-market bottom condition.
- $42K–$39K: the “overshoot” zone if panic selling drives a final flush below realized price.
If Bitcoin holds above the low $60Ks and keeps bouncing, the realized-price tag may never happen this cycle. If momentum breaks and $60K fails decisively, realized price becomes the next major magnet.
Bottom line: $55K is the realistic stress-test level. $39K is the capitulation tail-risk level that becomes relevant only if the market gets forced into a hard reset.
Read also: Bitcoin at $60K Could Be the Deal of the Decade
Articoli correlati
比特币ETF资金流入1.55亿美元,BTC价格能否延续反弹至8万美元?
比特币突破72000美元带动加密市场回升,以太坊、Solana、XRP集体上涨
XRP兑比特币关键突破仍在,分析师预测XRP或迎620%上涨、目标价10美元
特朗普推动加密货币监管框架,比特币大涨带动加密股票集体走高
山寨币关注度跌至两年低点,市场资金转向比特币,下一轮山寨季何时到来?