
Date: Tue, Dec 23, 2025 | 06:01 PM GMT
The broader cryptocurrency market has remained under pressure over the past several weeks, with the ongoing corrective phase weighing heavily on overall altcoin sentiment. Monad (MON) has also felt the impact of this weakness, as persistent selling pressure has kept price action subdued and volatile.
MON has declined by nearly 32% over the past 30 days, yet a closer look at the chart suggests that the current structure may be more constructive than it appears at first glance. Interestingly, Monad’s recent price behavior is beginning to resemble a bottoming pattern that previously played out on Hyperliquid (HYPE), a setup that eventually led to a powerful upside reversal earlier this year.
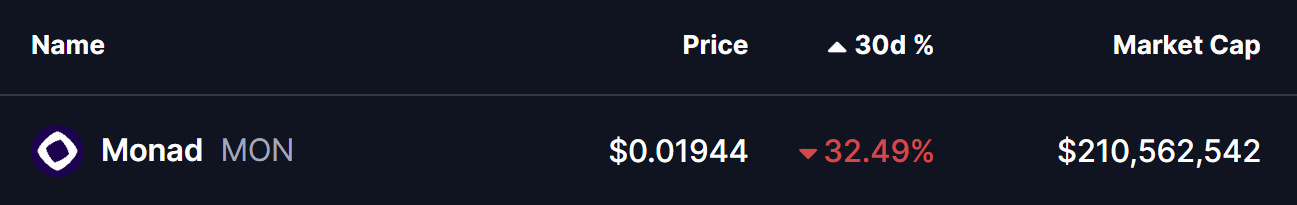
Source: Coinmarketcap
MON Mirrors HYPE’s Fractal Structure
On the comparative charts, MON appears to be tracing a structure strikingly similar to HYPE’s April 2025 fractal. In HYPE’s case, the token endured a deep 73% correction from its all-time high before forming a broadening wedge structure near the bottom. That consolidation phase ultimately resolved to the upside, with price reclaiming its key moving average and triggering a rally of more than 160% in the weeks that followed.
Monad’s decline from its own all-time high has reached roughly 65%, placing it well within the range of historical washout zones often associated with trend exhaustion. The current setup shows MON compressing within a symmetrical broadening wedge, a pattern that frequently precedes strong directional moves once price escapes the structure.
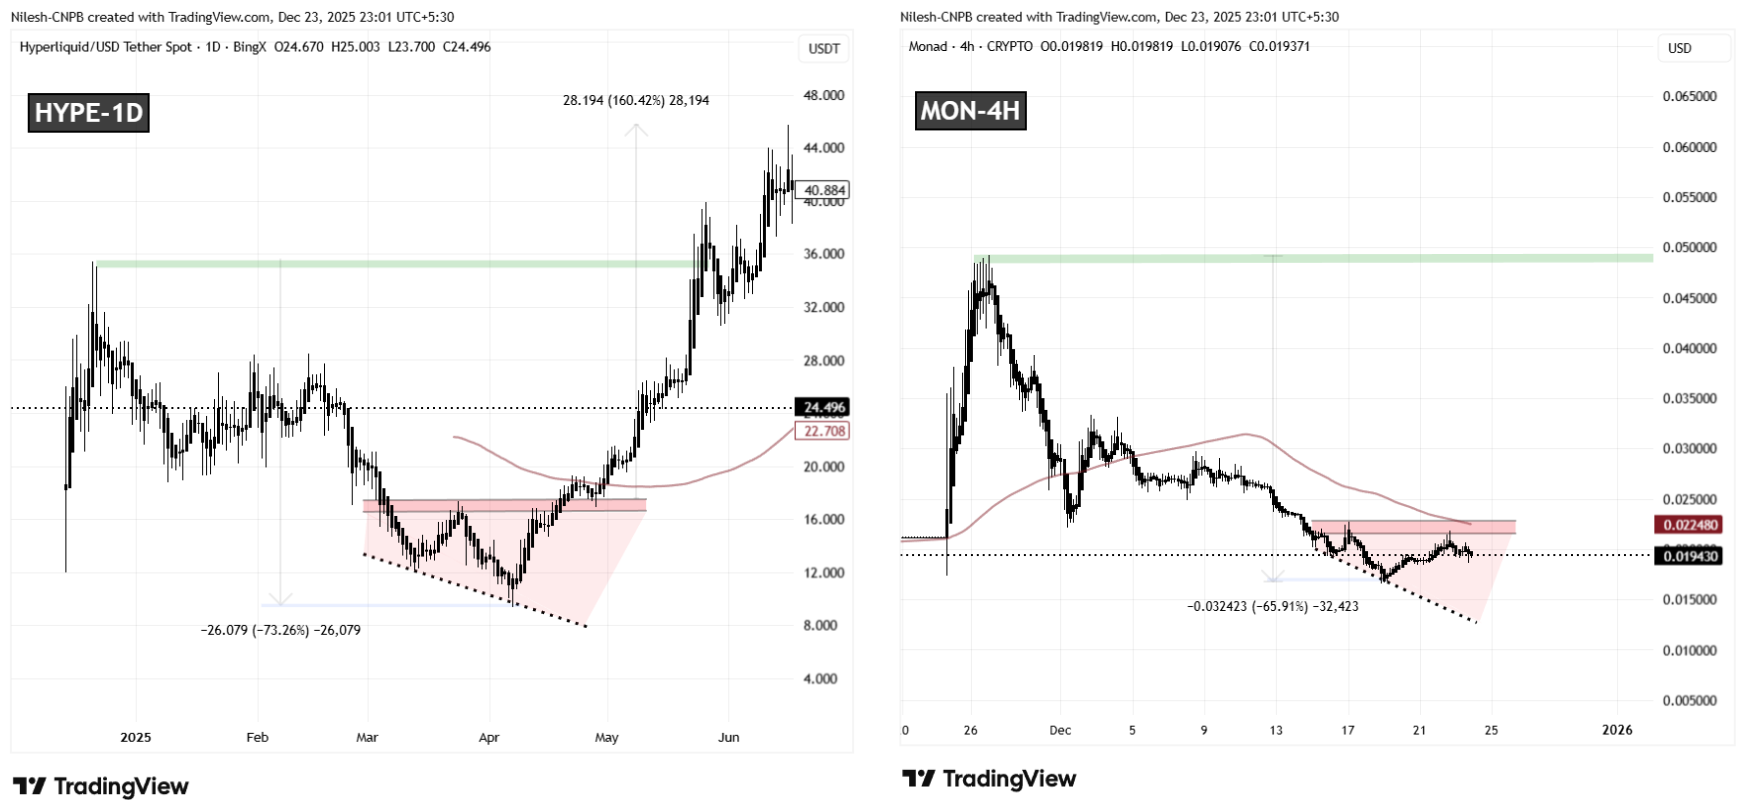
HYPE and MON Fractal Chart/Coinsprobe (Source: Tradingview)
This similarity becomes more compelling when viewed alongside the price behavior around resistance. MON is currently hovering just below a key neckline resistance band between $0.02170 and $0.02268, an area that closely mirrors the zone where HYPE consolidated before its breakout. The alignment between these two structures suggests that MON may be approaching a decision point.
What’s Next for MON?
Despite the growing resemblance to HYPE’s pre-breakout phase, the technical picture has not yet fully shifted in favor of the bulls. Sellers still retain short-term control, and confirmation is needed before a bullish reversal can be considered valid.
For momentum to flip decisively, MON would need to break above the upper boundary of the wedge and reclaim its 100 moving average, which sits near the $0.02248 level. A successful move above this region would signal improving trend strength and increase the probability that the fractal analogy continues to play out.
If such a breakout occurs, the upside potential becomes notable. A sustained bullish reversal could open the door for a broader recovery move toward the $0.049 area, which aligns with MON’s previous all-time high and represents roughly 155% upside from current levels. Until then, price action around resistance will remain critical in determining whether this fractal setup evolves into a full-fledged trend reversal or fails under continued market pressure.
**Disclaimer: **The views and analysis presented in this article are for informational purposes only and reflect the author’s perspective, not financial advice. Technical patterns and indicators discussed are subject to market volatility and may or may not yield the anticipated results. Investors are advised to exercise caution, conduct independent research, and make decisions aligned with their individual risk tolerance.
Disclaimer: The information on this page may come from third parties and does not represent the views or opinions of Gate. The content displayed on this page is for reference only and does not constitute any financial, investment, or legal advice. Gate does not guarantee the accuracy or completeness of the information and shall not be liable for any losses arising from the use of this information. Virtual asset investments carry high risks and are subject to significant price volatility. You may lose all of your invested principal. Please fully understand the relevant risks and make prudent decisions based on your own financial situation and risk tolerance. For details, please refer to
Disclaimer.
Related Articles
Dogecoin Flashes Rare Trend Reversal Signal, DOGE Price to $0.15? - U.Today
Dogecoin (DOGE) shows signs of a bullish reversal after a Heikin Ashi green candle emerged, suggesting potential for a rally to $0.15. Increased whale accumulation and trading volume bolster confidence in DOGE's upward trend.
UToday38m ago
Ethereum Price: Analyst Flashes Major ‘Buy’ Signal, Rally to $2,600 Soon?
March 16, 2026 8:15 pm EDT
TheCoinRepublic45m ago
BTC broke through $74,000 this week, with short-term holders' profits surging to $18.4 million per hour.
Gate News reported that on March 17, according to Glassnode data, Bitcoin price made a modest breakthrough above $74,000 this week, with short-term holder realized profit (STH-Realized Profit, 12-hour simple moving average) surging to $18.4 million per hour. This is consistent with the pattern observed in February: short-term holders continuously drain momentum from each bounce at the $70,000 level, absorbing upward momentum before any real breakout can form.
GateNews2h ago
Gold Shop Gold Purchase Loss 8%! Real Test "On-Chain Gold" Token PAXG Total Fees Crush Taiwan Bank Passbook
There are three ways for Taiwanese people to buy gold: Taiwan Bank Gold Passbook, gold shops, and on-chain gold token PAXG. Surveys show that despite PAXG appearing complex, its fees are actually the lowest, at approximately 1.2-3.2%. Gold shop transaction spreads reach as high as 8%, while Taiwan Bank is 2.3%. PAXG offers 24-hour liquidity, but the threshold for redeeming physical gold is high. Your choice should consider security, fees, and liquidity needs.
動區BlockTempo2h ago
ETH Price Chart Sees Bullish Pattern on Repeat, Is $30,000 ETH ATH a Possibility?
Pioneer altcoin ETH price chart sees bullish pattern on repeat.
Another expert expects $30,000 ATH target for ETH.
How high can the price of ETH go this year?
The crypto market grows steadily bullish once again as the price of Bitcoin (BTC) reclaims prices above the $74,00 price range an
CryptoNewsLand2h ago
