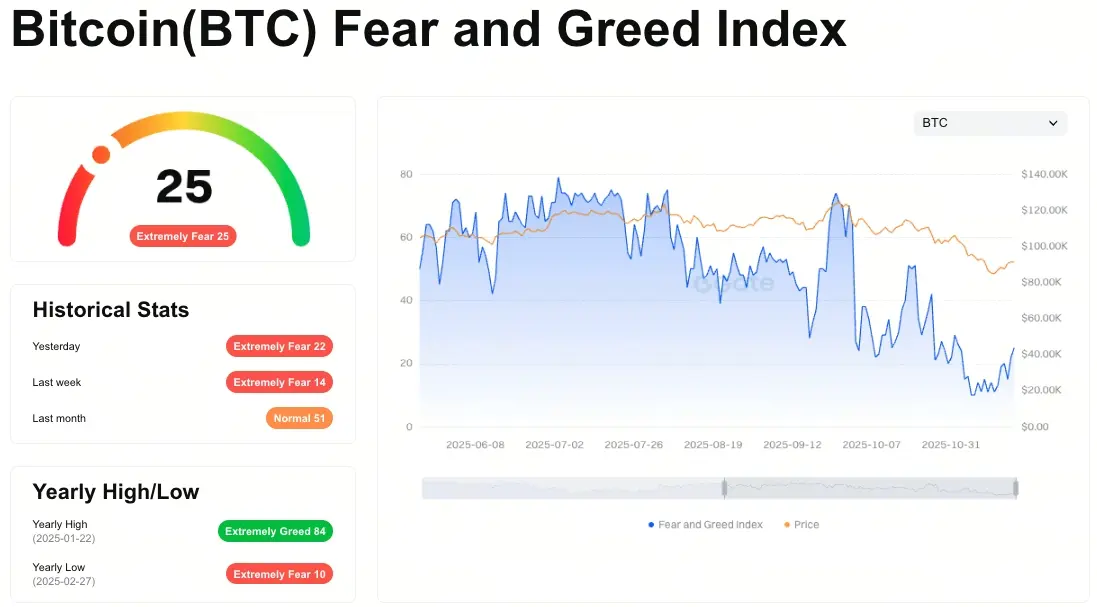
Gate platform's cryptocurrency market analysis on November 28 shows that the current price of Bitcoin is $90,899.8, with a key support level at $90,462. The fear and greed index is in a state of extreme fear (25), indicating a low market sentiment. In terms of alts, STZ has increased by 32.7% and SAFE has risen by 19.9%, showing that some funds are shifting towards smaller coins in search of excess returns.
Mainstream Coin Deep Analysis: BTC and ETH Both Under Pressure
(Source: Gate)
The current price of Bitcoin is $90,899.8, down 0.47% in the last 24 hours and down 10% over the week. Price momentum analysis shows that after a significant drop following a consolidation around $110,000, there is evident momentum weakness. The market is focused on the upcoming expiration of large options, which may lead to increased short-term volatility. In terms of key support and resistance, the support level is at $90,462.1 and the resistance level is at $91,942.2.
From a technical perspective, Bitcoin has broken through several key moving averages, with the 50-day EMA and 200-day EMA both being breached, which is considered a bear market confirmation signal in traditional technical analysis. Additionally, large options expirations often trigger significant volatility, as option holders adjust their hedging strategies before expiration, and this adjustment can amplify price fluctuations. The trading volume of BTC is 95.5 billion dollars, indicating good market depth, but this also means that if panic selling occurs, the liquidity is sufficient to absorb large sell orders, and the price may quickly decline.
The current price of Ethereum is $3,002.61, down 0.42% in the last 24 hours. Price momentum analysis shows that institutions have recently sold ETH and increased their holdings in BTC, reflecting a change in capital flow. This shift in institutional behavior is worth noting as it may indicate a lack of confidence among professional investors in ETH's short-term performance. Trend indicators suggest that September has historically been a month of weaker capital (note: the original may be incorrect, currently it is November), with expected short-term volatility rising. In terms of key support and resistance, the support level is at $2,986.25, and the resistance level is at $3,071.26. The trading volume for ETH is $3.06 million (note: could be $30.6 billion), indicating good market depth but weaker than BTC.
Comparison of Core Data between BTC and ETH
Bitcoin: $90,899.8, weekly drop 10%, support 90,462 / resistance 91,942, volume 95.5 billion dollars
Ethereum: $3,002.61, institutions shifting to BTC, support level 2,986 / resistance 3,071, trading volume relatively low
Capital Flow: Institutions selling ETH and increasing their BTC holdings indicate a positive outlook on BTC.
Options Risk: Large BTC options are about to expire, and short-term volatility expectations are rising.
Alts Against the Trend: Capital Rotation Seeking Excess Returns
When mainstream coins are under pressure, some alts show resilience with upward momentum. The current trading price of STZ is 0.00945 USD, with a pump of 32.7%, indicating strong market demand. The current trading price of SAFE is 0.1958 USD, up 19.9%, reflecting increased investor confidence. The current trading price of CROS is 0.0001088 USD, up 19.53%, showing active market participation.
This phenomenon of mainstream coins dropping while altcoins rise is referred to as “capital rotation” in crypto assets market analysis. When the upward momentum of BTC and ETH weakens or enters a consolidation phase, some speculative funds may shift towards smaller market cap altcoins with higher volatility in search of excess returns. This strategy is particularly common in the later stages of a bull market, but it also comes with higher risks, as altcoins generally have poorer liquidity and prices can fluctuate dramatically in a short period.
The 32.7% pump of STZ is particularly striking, as such a daily increase is extremely rare among mainstream coins. This may be due to a specific project development, collaboration announcement, or community speculation that triggered a short-term speculative frenzy. Traders need to be cautious of the pullback risk following such a surge, as price increases lacking fundamental support often struggle to sustain. The approximately 20% pump of SAFE and CROS is relatively mild, but it also requires attention to whether it can maintain momentum afterwards.
From the perspective of cryptocurrency market analysis, the collective rise of altcoins may suggest that market risk appetite is increasing, with some funds believing that the adjustments of mainstream coins have been sufficient and are beginning to seek new investment opportunities. However, this could also be the final frenzy; if mainstream coins continue to decline, the upward momentum of altcoins may quickly reverse.
Technical Signals and Market Sentiment: Fear and Greed Index 25 Extreme Fear
The Fear and Greed Index is at an extreme fear level (25), indicating a gloomy market sentiment. The Fear and Greed Index is a composite indicator that measures the sentiment of the Crypto Assets market, ranging from 0 (extreme fear) to 100 (extreme greed). A reading of 25 shows that market participants are generally pessimistic, and this sentiment can become self-reinforcing during price declines, as fear triggers more sell-offs, further pushing down prices.
However, from the perspective of contrarian indicators, extreme fear may also signal a buying opportunity. Historical data shows that when the Fear and Greed Index falls to the 20-30 range, it often approaches the market bottom, followed by a potential rebound. This “when others are fearful, I am greedy” strategy is widely used in Crypto Assets market analysis, but it needs to be combined with other technical indicators and fundamental factors for a comprehensive judgment.
At the same time, the higher trading volume and increased volatility may lead to greater uncertainty in the short term. The trading volumes for BTC and ETH are 95.5 billion and 3.06 million USD respectively (Note: ETH data may be incorrect, it should be in the billions), indicating good market depth. High trading volume combined with price decline usually means that a large number of chips are changing hands at low levels, which is a typical feature of the bottom building stage. The increase in volatility provides more trading opportunities but also demands stricter risk management.
There are certain arbitrage opportunities between mainstream coins, but risk management should be noted. The price differences between different exchanges, the basis between spot and futures, as well as the exchange rate differences between different trading pairs, may all provide arbitrage space. However, in a high volatility environment, arbitrage operations require quick execution and precise calculations, otherwise losses may occur due to rapid price changes.
Short-term and Medium-term Investment Strategy Recommendations
For short-term trading strategies (1-4 weeks), it is recommended to consider buying when BTC pulls back to around 90,462; ETH can be positioned near 2,986. These two price levels are key support levels of the previous consolidation platform and also areas where a large amount of capital is concentrated. If the price reaches these levels and shows signs of stopping the decline (such as increased trading volume, technical indicators showing oversold rebounds), you can build positions in batches.
In terms of take profit and stop loss settings, the BTC take profit is set at 92,000 and the stop loss is set at 89,000; the ETH take profit is set at 3,050 and the stop loss is set at 2,950. This setup provides a risk-reward ratio of approximately 1.5:1, which is relatively reasonable in the current high volatility environment. Strict execution of the stop loss is extremely important, as a breach of the support level could lead to an accelerated decline in price.
Position management suggests allocating 20%-30% of the position to mainstream coins, with the remainder spread among alts. This configuration balances stability and return potential, with mainstream coins providing a relatively safe base and alts offering excess return opportunities. However, the current market risk level is relatively high, so operations should be conducted cautiously to avoid excessive leverage or heavy positions in a single variety.
In terms of medium-term investment layout (1-6 months), the trend judgment is optimistic about the continuous upward potential of BTC and ETH, but we must be cautious of the impacts of policies and macroeconomics. The allocation suggestion recommends a 60% share for BTC and a 40% share for ETH. This allocation reflects the current market reality that institutional funds prefer BTC more. Key points to pay attention to include the release of regulatory policies and the investment dynamics of large institutions, such as ETF fund flows and the purchasing dynamics of listed companies.
Scenario analysis shows that in a bull market, it is appropriate to increase positions. If BTC breaks through the 92,000 resistance and stabilizes, positions can be raised to 40-50%; in a bear market, existing positions should be maintained while observing market changes. If it breaks below the 90,462 support level, consider reducing positions to 10-20% to control risk.
