The Near protocol (NEAR) price is up today. The project has been riding fresh AI-related momentum while much of the market has been moving sideways.
A new private execution layer called Confidential Intents just launched, aiming to reduce MEV and front-running risks, something that could attract larger trading flow.
However, announcements from NEARCON, including an AI-focused super app, helped spark a strong weekly rally.
The NEAR protocol price is up more than 10% in the past day, trading around $1.35, and outperforming the whole market. Trading volume spiked over 130%, showing real interest behind the move. Let’s look at the chart.
_****ChatGPT Predicts The Price Of Cardano And Polkadot If U.S. And Iran Agree To A Ceasefire**
- Here’s What NEAR Chart Is Showing
- What the Indicators Are Showing
- March Price Targets for NEAR
Here’s What NEAR Chart Is Showing
We had a look at the 4H chart, and NEAR has been in a clear downtrend for months.
Price previously topped above $3.00 before sliding steadily lower. The chart shows consistent lower highs and lower lows through December and January. However, something shifted in late February. NEAR found support near the $0.84–$0.90 region and began forming higher lows.
Now the Near Protocol price is testing the $1.35–$1.40 area, which previously acted as resistance. That zone is important. A clean hold above it could mark the first real structure shift in months.
The broader pattern still shows recovery mode, not full trend reversal. But momentum has clearly improved.
_****Here’s Why River (RIVER) Price Pumped 115%**
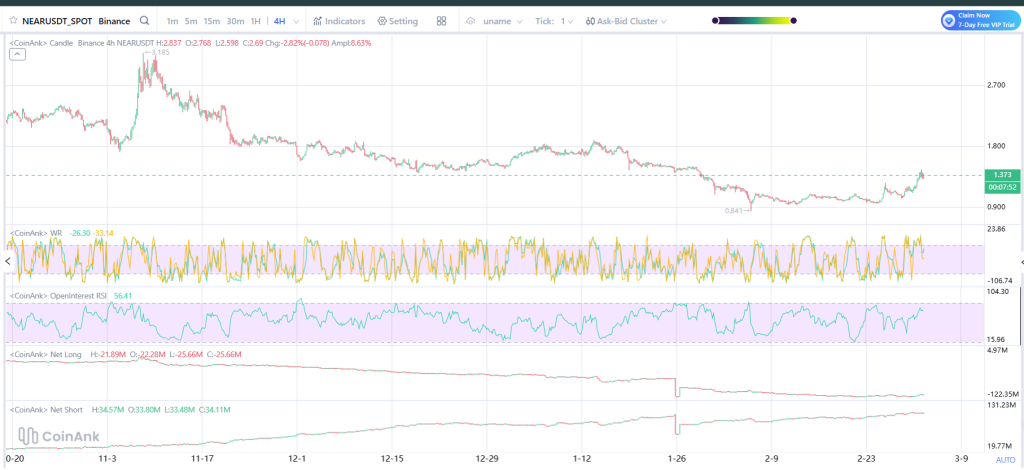
Source: Coinank
What the Indicators Are Showing
Williams %R has been spending more time near the top of its range lately. That usually means buyers are showing up more often than they were a few weeks ago.
Open Interest RSI is also moving higher. In simple terms, more traders are leaning toward upside continuation instead of betting against the move. That fits with the recent jump in trading activity.
During the long slide down, short positions kept building. Now that price is pushing higher, some of those shorts are being forced to close. When that happens, it can add extra fuel to the move.
The mood is clearly improving, but the chart still needs a clean break above resistance to fully confirm it.
_****3 AI Models Just Predicted Ripple (XRP) 2026 Floor Price And Potential Peak**
March Price Targets for NEAR
NEAR is sitting around $1.35, and the first line in the sand is between $1.40 and $1.45. That’s the area that needs to give way.
If price can move above that range and actually stay there, the next stop up the ladder looks close to $1.80. After that, the bigger wall stands around $2.20 to $2.40, where the last major drop began.
If things turn the other way and the NEAR price slips under $1.25, it could drift back toward $1.05–$1.10. If selling picks up, the old floor near $0.90 comes back into play.
At the moment, NEAR is trying to rebuild after months of pressure. If interest around its AI push keeps growing and buyers keep stepping in on dips, March could stay positive. But the real proof starts with a clean move above $1.40.
Disclaimer: The information on this page may come from third parties and does not represent the views or opinions of Gate. The content displayed on this page is for reference only and does not constitute any financial, investment, or legal advice. Gate does not guarantee the accuracy or completeness of the information and shall not be liable for any losses arising from the use of this information. Virtual asset investments carry high risks and are subject to significant price volatility. You may lose all of your invested principal. Please fully understand the relevant risks and make prudent decisions based on your own financial situation and risk tolerance. For details, please refer to
Disclaimer.
