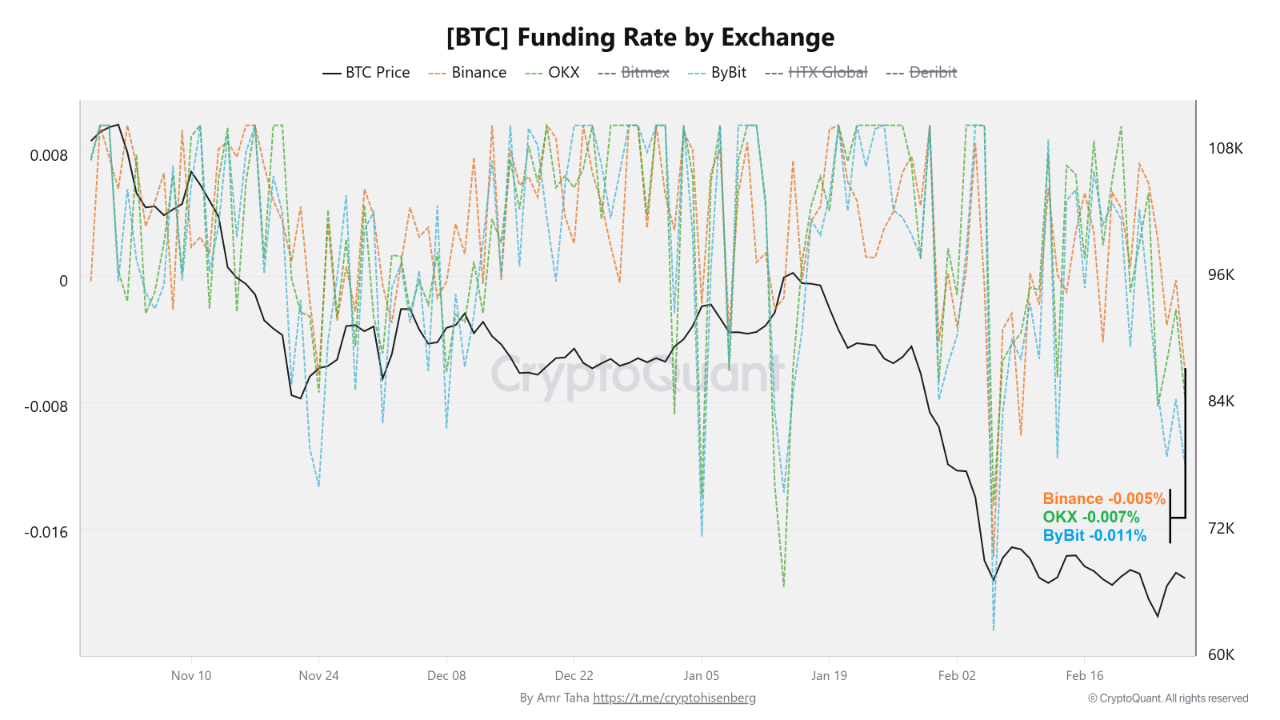
主要加密貨幣衍生品交易所的比特幣永續期貨資金費率,已分別降至 -0.005%、-0.007% 與 -0.011%,反映空頭在衍生品市場中佔據主導地位。分析師指出,當前的極端空頭比例在歷史上往往先於急劇反轉出現,但宏觀環境是否配合仍是關鍵變數。
資金費率機制與當前市場含義
在永續期貨合約中,資金費率是多空雙方之間定期交換的費用,用以維持合約價格與現貨市場的掛鉤。當資金費率為負值時,意味著空頭方需要向多頭方支付費用,通常反映出市場整體情緒強烈傾向看空。
分析師 Amr Taha 在 2 月 27 日的市場更新中引用了比特幣清算地圖數據:當前價格上方存在大量槓桿頭寸,許多空頭部位的開倉點集中在 92,000 美元附近。他指出,若比特幣出現向上突破,這些空頭部位將面臨強制平倉壓力,形成空頭擠壓效應並放大價格波動。
Taha 表示:「如果宏觀經濟條件改善,短期和中期內價格再次上漲的可能性將更高。」然而他同時強調,僅憑資金費率指標不足以單獨預測市場走向,過去大量空頭加上負資金往往預示急劇反轉,但需要結合更多指標綜合判斷。
散戶回歸與鯨魚流動:兩則方向相反的市場訊號
CryptoQuant 撰稿人 Nino 指出,散戶投資者的交易頻率已顯著高於一年均值,顯示個人資金在數週謹慎後正在回流市場,被視為潛在的情緒改善信號。
然而,鯨魚動向提示了不同方向的信號。Taha 追蹤到約 1,700 枚比特幣從「Octopus」錢包群組(代表中期持有投資者)流入幣安。值得對比的是,同一群組在 2025 年 2 月 2 日曾有 5,000 枚比特幣流入幣安,隨後比特幣從 77,500 美元以上開始下跌。此次流入規模顯著偏小,Taha 評估:「這次的強度較低,潛在拋售壓力可能不如以前那麼強。」
比特幣於 2 月 26 日曾測試 70,000 美元大關但未能守住,截至撰文時交易於 68,000 美元附近,24 小時跌幅 0.4%,已橫盤整理七日。Glassnode 的分析師則指出,儘管市場出現短暫穩定,比特幣尚未顯示真正的底部恢復訊號。
當前比特幣市場關鍵數據速覽
 (來源:CryptoQuant)
資金費率:主要交易所全面負值,為 -0.005% 至 -0.011% 區間
7 日走勢:橫盤整理,交易於 68,000 美元附近(24 小時跌幅 0.4%)
30 日表現:下跌約 24%
距歷史高點(2025 年 10 月):約下跌 46%
92,000 美元附近:清算地圖顯示密集空頭部位,一旦突破可能觸發空頭擠壓
常見問題
比特幣資金費率轉負代表什麼,對普通投資者有何參考意義?
資金費率為負意味著衍生品市場中空頭比例偏高,空頭方需向多頭方支付費用以維持持倉。對普通投資者而言,這一指標反映衍生品市場的整體情緒偏空,但它本身並不直接決定現貨市場走向,通常需與清算地圖、未平倉合約量等指標結合使用,才能提供更完整的市場結構分析。
什麼是「空頭擠壓(Short Squeeze)」,資金費率負值如何增加其發生概率?
空頭擠壓是指大量空頭部位集中存在時,一旦價格上漲,空頭被迫在上方補倉平倉,進一步推高價格形成連鎖反應。資金費率極端負值顯示空頭規模龐大,加之清算地圖顯示 92,000 美元附近有密集空倉,若有足夠的上行催化劑,大規模強制平倉可能加速和放大上漲波動。
比特幣距歷史高點下跌 46%,是否可以判斷底部已形成?
僅憑跌幅本身無法確定底部,底部確認通常需要多項技術面和鏈上指標的共同驗證。Glassnode 分析師指出,儘管市場近期出現短暫穩定,但尚未顯示真正的底部恢復訊號,投資者應綜合評估資金費率、ETF 資金流向、散戶活躍度等多維度數據,而非依賴單一指標進行判斷。
Disclaimer: The information on this page may come from third parties and does not represent the views or opinions of Gate. The content displayed on this page is for reference only and does not constitute any financial, investment, or legal advice. Gate does not guarantee the accuracy or completeness of the information and shall not be liable for any losses arising from the use of this information. Virtual asset investments carry high risks and are subject to significant price volatility. You may lose all of your invested principal. Please fully understand the relevant risks and make prudent decisions based on your own financial situation and risk tolerance. For details, please refer to
Disclaimer.
Articoli correlati
PEPE Price at $0.053259 as Tight Range and Falling Volume Shape Short-Term Market Activity
PEPE was traded at $0.053259 and has recorded a 3.0 percent fall in value but it is within a thin band of support and resistance.
The market exhibited a volume of 235.15M in 24 hour trading, which is a decline of 19.16% reflecting less trading activity.
Technical indicators are not
CryptoNewsLand1h fa
Aave Price Holds Near $111 After $27M Liquidation Error Shakes DeFi
Key Insights
Aave traded near $111 after a CAPO oracle configuration error triggered $27 million in liquidations across 34 wstETH-backed accounts.
Trading activity cooled as derivatives volume dropped and open interest declined, signaling that traders stepped back following the liquidation in
CryptoFrontNews1h fa
XRP Holds $1.34 Support While Leverage Heatmap Highlights $1.30 Risk Zone
XRP is trading at $1.36 in a tight range of support at $1.34 and resistance at $1.37.
The heatmap data indicates that there is a huge amount of long positions in the range of $1.30.
Should prices fall to around $1.30, long positions with high leverage in this region might
CryptoNewsLand2h fa
Crypto Market Update – River and Hyperliquid Lead Gainers As Decentralized Infrastructure Gains M...
The crypto market is displaying its typical volatility once again, yet under the noise of price movements, the beginnings of a narrative are starting to take shape. As of today, the “Top Gainers” on CoinMarketCap leans heavily towards projects targeting decentralized infrastructure and fast Layer-1s
BlockChainReporter2h fa
Solana Approaches Key Sell Wall at $84.78 — Will Momentum Hold for a Move Toward $89?
Solana is trading at an approximate price of $83.18, although a solid sell wall is at an approximate price of $84.78, which prevents upward movement.
The price is trapped between the support at $81.99 and the resistance at $84.78 which is short term consolidation.
Once buyers hit the
CryptoNewsLand3h fa
SOL Consolidates Near $84 While Chart Highlights Possible $45 Demand Zone
Solana (SOL) trades at $83.87 within a range defined by $81.03 support and $84.43 resistance, showing consolidation below a $90 supply zone. There is a broader demand area near $45, indicating potential downward movement before recovery.
CryptoNewsLand3h fa