
Key Takeaways
-
Monad (MON) has dropped nearly 41% over the past two months but is showing early signs of stabilization.
-
Price action suggests a potential double bottom pattern forming near the $0.018 support zone.
-
Buyers have repeatedly defended the same support level, hinting at fading selling pressure.
-
A move above the 50-day moving average could strengthen the short-term bullish outlook.
-
A confirmed breakout above the $0.02970 neckline may open the door for a stronger recovery rally.
Monad (MON), the native token of the Monad Layer-1 blockchain, has been under pressure in recent weeks. The token is down roughly 41% over the past 60 days, driven by a slowdown in TVL growth and a decline in application-level revenue across the ecosystem.
However, sentiment may be starting to shift. MON posted a 12% bounce today, and more importantly, its price structure on the daily chart is beginning to show early signs of a bullish reversal — suggesting the downside momentum could be losing steam.
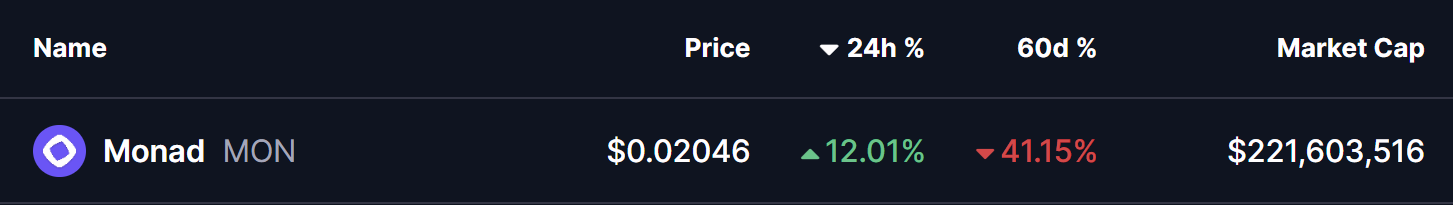
Source: Coinmarketcap
Double Bottom Pattern in Play
On the daily timeframe, MON appears to be forming a potential double bottom pattern, a classic bullish reversal structure that often develops near the end of extended downtrends.
The first bottom was formed when MON dropped toward the $0.018 support zone, followed by a rebound that carried price back toward the neckline resistance near $0.02970. That recovery attempt was rejected, sending MON back down to retest the same support level.
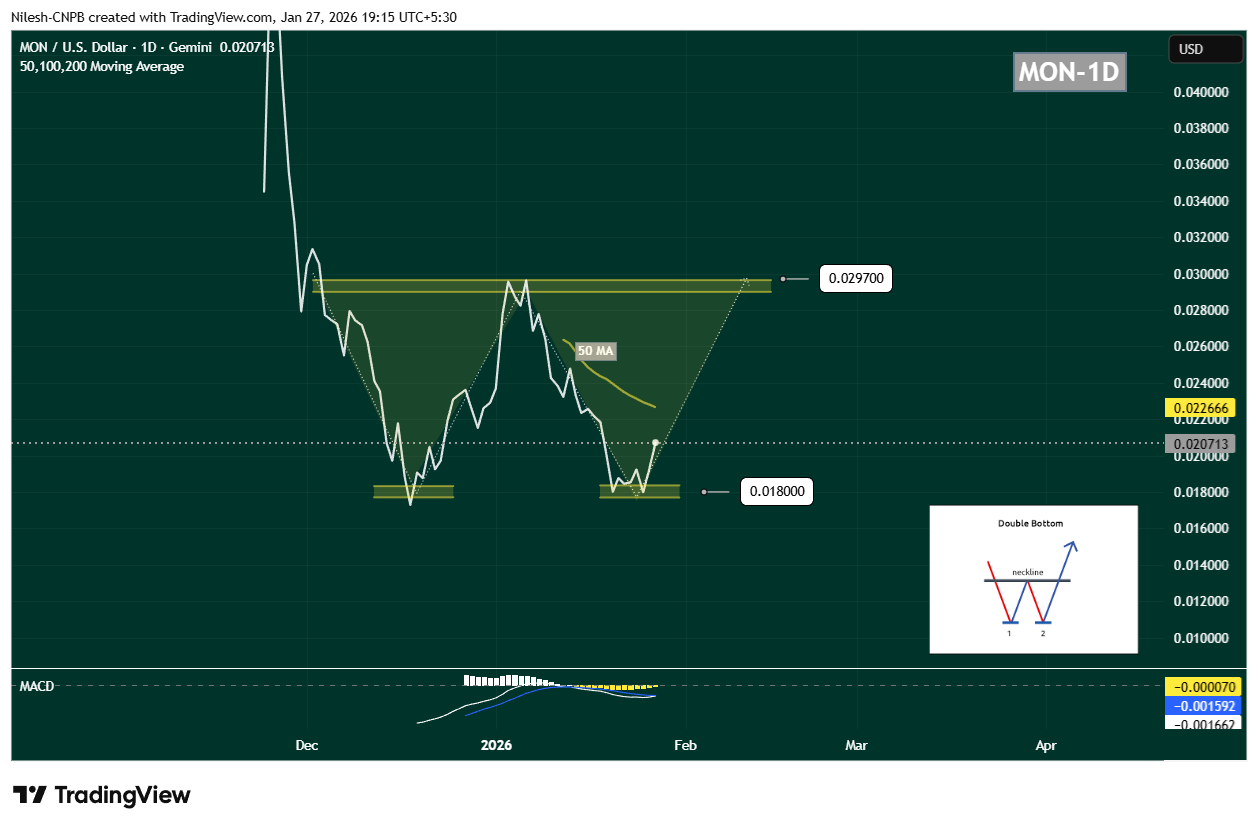
Monad (MON) Daily Chart/Coinsprobe (Source: Tradingview)
What’s notable this time is buyer behavior. Once again, demand emerged around $0.018, preventing a breakdown and forming the second bottom of the structure. MON is currently trading near $0.02071, indicating that selling pressure may be fading.
Momentum indicators are starting to support this view. The MACD is showing early signs of a potential bullish crossover, often seen as an initial signal that downside momentum is weakening and buyers may be preparing to step back in.
What’s Next for Monad (MON)?
For this bullish setup to gain credibility, MON needs to reclaim the 50-day moving average, which is currently positioned near $0.02266. A sustained move above this level would signal a shift in short-term momentum and improve the probability of a recovery rally.
If buyers manage to push price back toward the $0.02970 neckline, the market will be watching closely. A decisive breakout above this resistance, ideally followed by a successful retest, would confirm the double bottom pattern and open the door for a stronger upside move.
On the downside, the $0.018 support zone remains the most critical level to defend. A breakdown below this area would invalidate the bullish structure and likely expose MON to another leg of downside or extended consolidation.
Bottom Line
Despite recent weakness, MON’s technical structure is starting to look constructive. The repeated defense of identical lows, the emergence of a double bottom pattern, and improving momentum signals suggest that Monad could be approaching a potential turning point.
If key support continues to hold and the token reclaims its short-term moving averages, MON may be setting the stage for a recovery phase — especially if broader market conditions stabilize in the days ahead.
Disclaimer: The views and analysis presented in this article are for informational purposes only and reflect the author’s perspective, not financial advice. Technical patterns and indicators discussed are subject to market volatility and may or may not yield the anticipated results. Investors are advised to exercise caution, conduct independent research, and make decisions aligned with their individual risk tolerance.
About Author: Nilesh Hembade is the Founder and Lead Author of Coinsprobe, with over 5 years of experience in the cryptocurrency and blockchain industry. Since launching Coinsprobe in 2023, he has been providing daily, research-driven insights through in-depth market analysis, on-chain data, and technical research.
Disclaimer: The information on this page may come from third parties and does not represent the views or opinions of Gate. The content displayed on this page is for reference only and does not constitute any financial, investment, or legal advice. Gate does not guarantee the accuracy or completeness of the information and shall not be liable for any losses arising from the use of this information. Virtual asset investments carry high risks and are subject to significant price volatility. You may lose all of your invested principal. Please fully understand the relevant risks and make prudent decisions based on your own financial situation and risk tolerance. For details, please refer to
Disclaimer.
Articoli correlati
XRP Price Structure Tightens While Heatmap Highlights $1.30 Liquidity Zone
XRP trades near $1.37 support after a 0.9% daily decline, while the $1.44 level remains the immediate resistance in the current range.
A three-week liquidity heatmap highlights a large order cluster around $1.30, indicating a strong liquidity zone below price.
A three-month Gaussian
CryptoNewsLand14m fa
Billionaire Investor Stanley Druckenmiller Bullish on Stablecoin Growth
Billionaire investor Stanley Druckenmiller believes stablecoins will become the backbone of the financial system in 10-15 years, citing their efficiency. However, he views much of the wider crypto market as unnecessary, describing it as “a solution looking for a problem.”
Decrypt34m fa
SOL Consolidates Near $84 While Chart Highlights Possible $45 Demand Zone
Solana (SOL) trades at $83.87 within a range defined by $81.03 support and $84.43 resistance, showing consolidation below a $90 supply zone. There is a broader demand area near $45, indicating potential downward movement before recovery.
CryptoNewsLand1h fa
BTC 15分钟下挫0.63%:宏观数据打压风险偏好叠加ETF资金流出加剧抛压
2026-03-13 17:15 至 2026-03-13 17:30(UTC)期间,比特币(BTC)15分钟K线波动加剧,收益率录得-0.63%,报价在71600.0至72243.9 USDT之间,振幅达到0.89%。异动引发市场关注,订单薄压力显现,短线资金两极分化明显。
本次异动的主要驱动力来自宏观经济数据公布后市场风险偏好骤降以及ETF资金净流出。美国最新GDP数据下修至0.7%,远低于
GateNews1h fa
BTC 15分钟上涨0.62%:地缘冲突推升避险需求与链上资金共振驱动上行
2026-03-13 16:30 至 2026-03-13 16:45(UTC),BTC价格在71379.5 USDT至71870.0 USDT区间波动,15分钟内收益率录得+0.62%,振幅达到0.69%,带动市场关注度显著升温。短线资金活跃,波动节奏加快,显示市场避险情绪占据主导。
本次异动的主要驱动力是全球宏观地缘冲突升级引发油价飙升,触发传统风险资产普遍承压。美股等主流市场出现资金流出
GateNews1h fa
PEPE Consolidates Above $0.05324 Support as Momentum Strengthens and Resistance Near $0.05336 Holds
PEPE has a tight intraday price compression with a support level of $0.053243 and resistance level of $0.053363.
A RSI of 64.13 represents the moderate bullish momentum whereas MACD history is slightly positive, which indicates the gradual buying momentum.
The price is at $0.053364
CryptoNewsLand2h fa