
Key Takeaways
-
SKY is forming a rounding bottom pattern on the daily chart
-
Price has rebounded strongly from the $0.0419 demand zone
-
Rising volume supports improving bullish momentum
-
A breakout above $0.0778 could confirm trend reversal
-
Pattern projection points toward the $0.11 region
Sky (SKY), the native governance and utility token of the Sky Protocol (formerly MakerDAO), has stepped into the spotlight after posting a strong daily move of over 8%, accompanied by a sharp 35% surge in trading volume. While the short-term momentum is drawing attention, the more compelling story is unfolding on the higher timeframe chart.
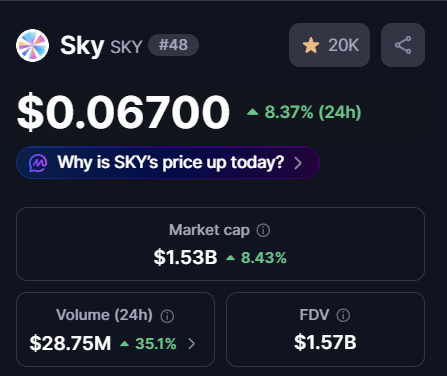
Source: Coinmarketcap
Price action is now forming a classic bullish reversal structure — one that often signals the transition from prolonged weakness into a new recovery phase.
Rounding Bottom Pattern Signals Trend Shift
On the daily timeframe, SKY appears to be completing a rounding bottom formation, a well-known bullish reversal pattern that typically develops after extended downtrends. This structure reflects a gradual shift in market psychology, where persistent selling pressure slowly fades and long-term accumulation begins to dominate.
Earlier in the trend, SKY faced repeated rejection near the $0.0778 neckline resistance, which triggered a steep sell-off. That decline ultimately bottomed near $0.0419, marking a critical demand zone where buyers aggressively stepped in and prevented further downside.
Since establishing this low, price action has steadily curved higher, forming a smooth rounded base. This gradual recovery — rather than a sharp V-shaped bounce — suggests healthier accumulation rather than short-term speculation.
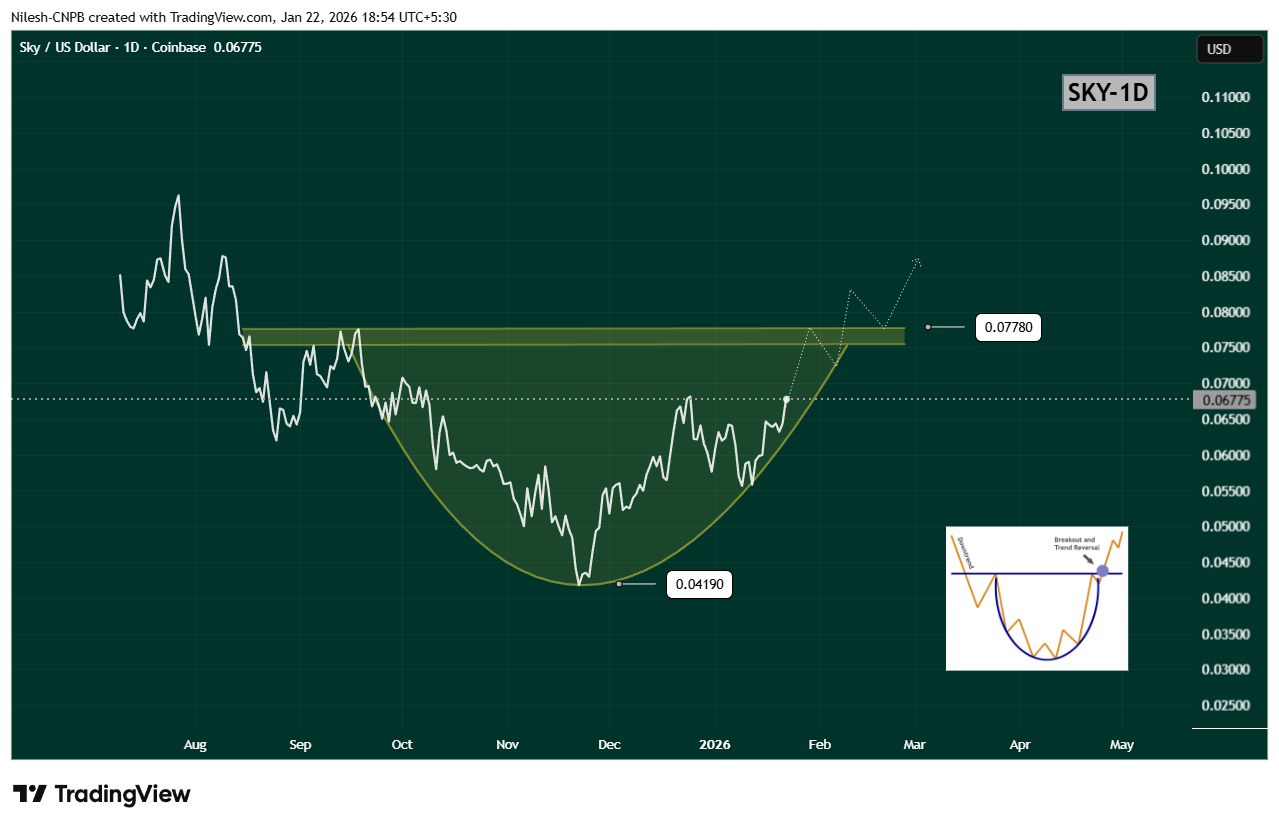
$SKY Daily Chart/Coinsprobe (Source: Tradingview)
Breakout Zone Comes Into Focus
Recent price action shows SKY reclaiming the $0.06933 region, a level that previously acted as resistance. This move strengthens the bullish structure and signals that buyers are gaining confidence ahead of a potential neckline test.
The key level to watch now is the $0.0778 resistance zone. A decisive daily close above this level would confirm the rounding bottom breakout and mark a clear shift in trend structure. Ideally, a breakout followed by a successful retest of this zone as support would further validate the bullish case.
Upside Projection and Risk Outlook
Based on the depth of the rounding bottom, the measured upside projection points toward the $0.11 region. Reaching this target would represent a potential 60–65% upside from current levels, aligning well with historical behavior of similar reversal patterns.
That said, patience remains important. Before any confirmed breakout, SKY could still experience short-term pullbacks or consolidation near the rising curve of the pattern. Such moves would not invalidate the bullish setup, as long as price continues to hold above recent higher lows.
A breakdown below the rounding base would weaken the structure, but for now, momentum favors the bulls.
Bottom Line
SKY is showing clear signs of a trend reversal in progress, with a rounding bottom pattern taking shape on the daily chart. Rising volume, improving structure, and a steady recovery toward neckline resistance all suggest that accumulation is underway.
If SKY can break and hold above $0.0778, the path opens toward the $0.11 region, signaling a broader bullish continuation. Until then, consolidation and minor pullbacks remain possible — but the overall structure is one that traders will be watching closely.
Disclaimer: The views and analysis presented in this article are for informational purposes only and reflect the author’s perspective, not financial advice. Technical patterns and indicators discussed are subject to market volatility and may or may not yield the anticipated results. Investors are advised to exercise caution, conduct independent research, and make decisions aligned with their individual risk tolerance.
About Author: Nilesh Hembade is the Founder and Lead Author of Coinsprobe, with over 5 years of experience in the cryptocurrency and blockchain industry. Since launching Coinsprobe in 2023, he has been providing daily, research-driven insights through in-depth market analysis, on-chain data, and technical research.
Disclaimer: The information on this page may come from third parties and does not represent the views or opinions of Gate. The content displayed on this page is for reference only and does not constitute any financial, investment, or legal advice. Gate does not guarantee the accuracy or completeness of the information and shall not be liable for any losses arising from the use of this information. Virtual asset investments carry high risks and are subject to significant price volatility. You may lose all of your invested principal. Please fully understand the relevant risks and make prudent decisions based on your own financial situation and risk tolerance. For details, please refer to
Disclaimer.
Articoli correlati
XRP Climbs 3% Past $1.47 as Breakout Extends on Bitcoin-Led Rally
Key Takeaways
XRP broke above $1.426 resistance after months of consolidation, jumping to $1.47 on surging volume
Trading volume spiked over 250% during the move, indicating strong participation in the breakout
Activity on the XRP Ledger continues climbing, with tokenized real-world assets
CryptoBreaking4m fa
Dogecoin (DOGE) at Key Juncture as Bollinger Bands Widen, Where to Next? - U.Today
Dogecoin (DOGE), the leading market meme coin, is showing signs of an uptrend, with the price testing the upper Bollinger Bands. Meanwhile, the trading volume dropped 40%, indicating low conviction moves by investors.
Dogecoin sees 40% drop in volume
According to CoinMarketCap data, the Dogecoin
UToday17m fa
BTC 15分钟下跌0.65%:现货大额卖盘主导短线回调,恐慌情绪加剧放大波动
2026-03-20 13:45 至 2026-03-20 14:00(UTC),BTC在15分钟内下跌0.65%,价格区间波动于69795.3至70399.4 USDT,期间振幅达到0.86%。市场波动短线加剧,交易活跃度提升,投资者关注度升温。
本次异动的主要驱动力是现货市场大额主动卖盘集中释放。该时段主流交易平台出现多笔单笔超过100 BTC的大宗卖单,卖盘占比达52%,直接主导价格向下
GateNews1h fa
Shiba Inu Burns Over Four Million SHIB as Price Prints Comeback - U.Today
The Shiba Inu (SHIB) meme coin has climbed past a key resistance level amid a more than 370% surge in burn rate. At the moment, SHIB is trading at $0.000006, demonstrating a moderate rally on the daily charts after breaking the current resistance zone.
370% spike in Shiba Inu burn rate
As
UToday1h fa
AI Cryptocurrency Bittensor TAO Leads the List of Trending Tokens
Bittensor (TAO) is currently the top trending cryptocurrency, gaining 14.21% in 24 hours, while ZBCN and PHA follow. TAO is expected to face a brief correction, highlighting the volatile nature of crypto markets.
TheNewsCrypto2h fa
Ethereum Near Bottom? Tom Lee Signals Market Turnaround
Tom Lee believes Ethereum has reached a bottom, citing historical correlations and a significant discount to realized price, despite skepticism from some users. Ethereum's current price is down over 50% from its 52-week high, with potential for recovery.
TheNewsCrypto2h fa
