
Date: Fri, Dec 26, 2025 | 06:30 PM GMT
The broader cryptocurrency market has been navigating a period of choppy and uncertain price action over the past several weeks, a phase that began after the sharp market-wide sell-off on October 10. During that correction, Ethereum (ETH) dropped nearly 28% over the last 60 days, applying sustained pressure across the altcoin sector — including ether.fi (ETHFI).
ETHFI has mirrored this weakness, sliding more than 31% over the same period. However, despite the sharp downtrend, recent price behavior suggests selling pressure may be easing. The token is now trading near a historically significant demand zone, where buyers have repeatedly stepped in before — raising the possibility that ETHFI could be approaching an inflection point.
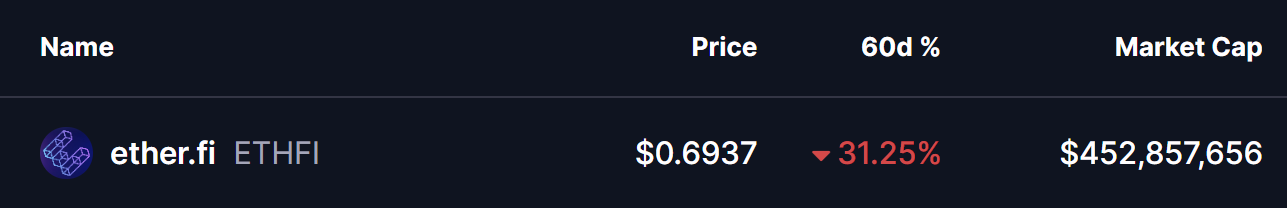
Source: Coinmarketcap
Double Bottom Pattern in Focus
On the daily timeframe, ETHFI appears to be forming a potential double-bottom structure — a classic reversal pattern that often signals exhaustion among sellers. The setup began after ETHFI was rejected from the $0.9233 resistance area, a move that triggered a sharp decline of nearly 28% and pushed price back toward the lower end of its range.
That sell-off dragged ETHFI into the $0.65 support zone, a level that has consistently acted as a strong demand area in the past. The chart now shows price revisiting this same region and stabilizing once again, suggesting buyers are actively defending it. The similarity between the first and second lows strengthens the case that a double-bottom base may be forming.
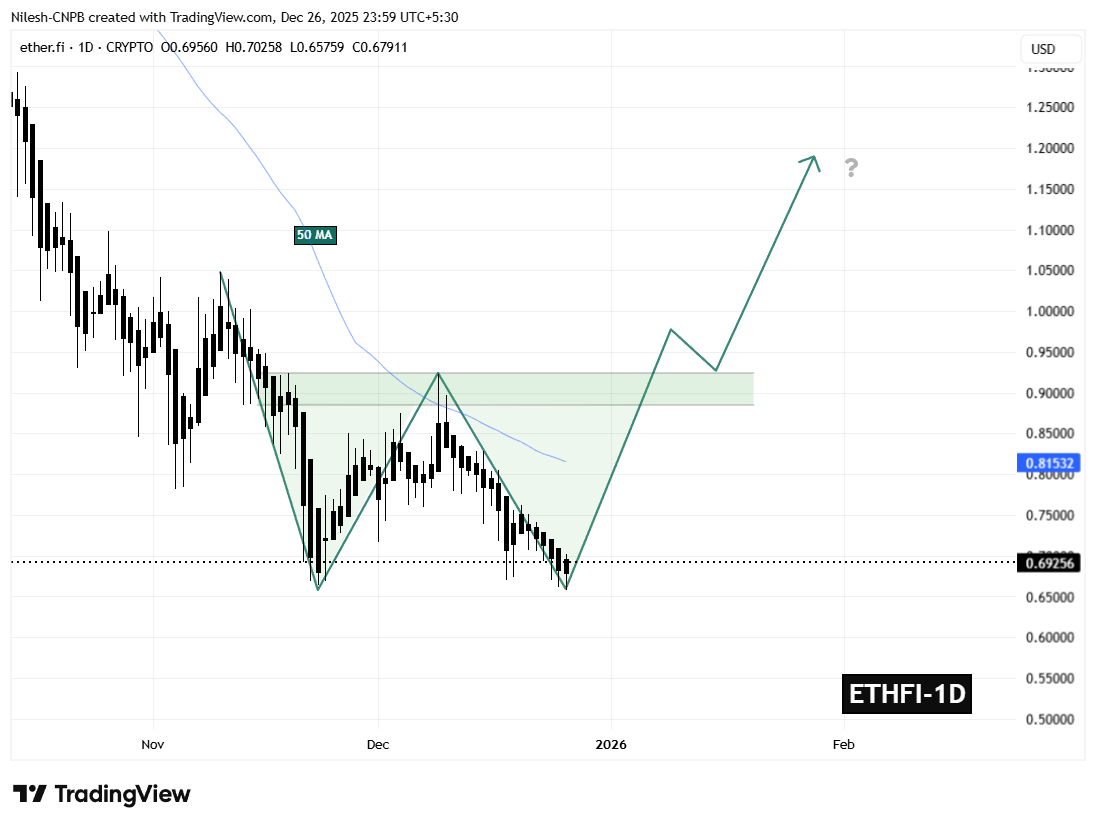
ETHFI Daily Chart/Coinsprobe (Source: Tradingview)
If this support continues to hold, the ongoing consolidation could mark the completion of the second bottom — a critical step in shifting momentum away from sellers and toward a potential trend reversal.
What’s Next for ETHFI?
The $0.65 support zone remains the most important level to monitor in the near term. As long as ETHFI holds above this area, the developing bullish structure remains valid and provides room for momentum to gradually rebuild.
On the upside, the first major challenge sits at the 50-day moving average near $0.8153. This level has repeatedly capped recovery attempts throughout the recent downtrend and now represents the initial test for buyers. A sustained move above this moving average would signal improving market structure and growing bullish confidence.
Beyond that, the $0.9233 neckline stands as the key confirmation level. A decisive breakout above this resistance would complete the double-bottom pattern and significantly strengthen the bullish outlook, potentially opening the door for a broader recovery move in the weeks ahead.
For now, ETHFI finds itself at a technically pivotal zone — one that could either reinforce the existing downtrend or mark the beginning of a meaningful rebound if buyers continue to defend support.
Disclaimer: The views and analysis presented in this article are for informational purposes only and reflect the author’s perspective, not financial advice. Technical patterns and indicators discussed are subject to market volatility and may or may not yield the anticipated results. Investors are advised to exercise caution, conduct independent research, and make decisions aligned with their individual risk tolerance.
Disclaimer: The information on this page may come from third parties and does not represent the views or opinions of Gate. The content displayed on this page is for reference only and does not constitute any financial, investment, or legal advice. Gate does not guarantee the accuracy or completeness of the information and shall not be liable for any losses arising from the use of this information. Virtual asset investments carry high risks and are subject to significant price volatility. You may lose all of your invested principal. Please fully understand the relevant risks and make prudent decisions based on your own financial situation and risk tolerance. For details, please refer to
Disclaimer.
Articoli correlati
分析师:4 月或成比特币关键观察期,RSI 处中性区间、波动率或抬升
4月通常是比特币表现较强的月份,历史均涨幅约11.3%。但自2020年以来,该规律变得不稳定。当前比特币的相对强弱指标为47%,市场情绪受地缘政治和通胀担忧影响,预示4月波动率可能上升,需关注市场能否形成明确方向。
GateNews32m fa
The Old Token Playbook Is Dead: Why Most Crypto Launches Failed in 2025
The old “token playbook” is over, according to 21Shares researcher Darius Moukhtarzade, who said that launching at high FDV, low float with a governance “meme coin” does not work anymore.
Moukhtarzade explained that there is a widening “sentiment-fundamentals gap” as the core reason behind
CryptoPotato39m fa
ETH 15分钟上涨0.62%:ETF净流入与流动性收紧共振驱动短线走强
2026-04-01 03:00至03:15(UTC),ETH价格出现异动,区间收益率为+0.62%,K线最低点2088.43 USDT、最高点2106.93 USDT,振幅达0.89%。在加密资产普遍波动加剧的背景下,ETH短线成交活跃,链上热度提升,市场关注度明显上升。
本次异动的主要驱动力是美国现货ETF资金净流入持续放大,ETF净流入在4月初延续3月底的强劲势头,带动ETH现货需求显著上
GateNews1h fa
比特币逼近关键“买入区”?链上数据揭示BTC真实底部信号仍未出现
比特币价格接近市场关注的“买入区域”,但底部信号尚未完全形成,目前价格高于成本区间,表明市场尚未经历重大清理。溢价持续收窄,反映出泡沫正在消化。尽管短期内市场可能面临压力,仍有资金提前布局,显示出对未来前景的乐观。
GateNews1h fa
分析師:比特幣供應結構「易手」,巨鯨與企業交易脫鉤
XWIN Research 的分析指出,比特幣在 2026 年第一季經歷結構性供應轉移,交易所巨鯨比率上升,顯示大型持有者正出售比特幣,而上市公司如微策略等卻凈增持 62,000 枚比特幣。市場呈現交易所巨鯨和企業囤積的二元化趨勢,供應從早期投資者轉移到企業資產負債表上,並且市場流動性未能顯著改善。
MarketWhisper1h fa
Bitcoin’s Most Dangerous Pattern Just Triggered: Will BTC Dump to $26K Next?
Although bitcoin has already dumped by over 50% from its all-time high of over $126,000 marked in October to a multi-year low of $60,000, the asset’s troubles might not be over, warned Merlijn The Trader.
The popular analyst indicated that the “most dangerous bitcoin pattern just completed phase
CryptoPotato2h fa
