- KAITO surged 21%, trading around the $0.60 range.
- Daily trading volume has skyrocketed by over 1,387%.
The broader crypto market remains choppy, swinging between red and green and reflecting ongoing indecision. The largest assets like Bitcoin (BTC) and Ethereum (ETH) remain under a prolonged bearish trajectory, losing momentum. Notably, KAITO has bucked the trend, posting a solid and steady 21.46% jump
In the early hours, the asset was trading within a low range of $0.4898. The bullish encounter has pushed KAITO to mount toward a high level of $0.6387, testing and breaking the crucial resistances between $0.49 and $0.62. With bulls sustaining strength, the market could set the stage for a rally to new highs.
At the time of writing, KAITO traded within the $0.6085 zone, with its market cap reaching $147.15 million. Moreover, the asset’s daily trading volume has skyrocketed by over 1387% touching the $110.76 million mark. As per Coinglass data, the market has experienced a 24-hour liquidation of $1.14 million in KAITO
After the Surge, Can KAITO Bulls Hold the Line?
The Moving Average Convergence Divergence (MACD) line of KAITO has crossed above the signal line, showcasing the presence of bulls. Also, the trend may continue to move higher. Besides, the Chaikin Money Flow (CMF) indicator found at 0.61 implies strong buying pressure, with steady capital flow into the asset. If it stays this high, it likely supports the uptrend
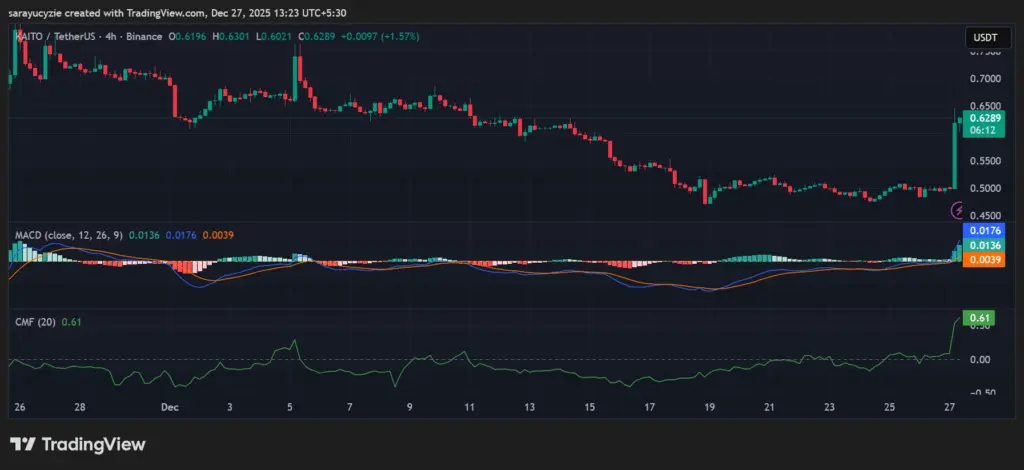 *KAITO chart (Source: TradingView)*With the bullish outlook, the price of KAITO might jump toward the $0.61 resistance level. Upon maintaining this trading zone, the bulls could spark a potential upward correction and trigger the golden cross to take place. Eventually, the price could rise to $0.62
A downside reversal might open the way to recent lows, which brings in a retest at the $0.59 support. A sustained bearish pressure could push the death cross to emerge, and the bears would likely take the KAITO price down to the $0.58 range or even lower.
KAITO’s Bull Bear Power (BBP) value of 0.1560 indicates moderate bullish strength, but the momentum is not strong. If it rises further, buying pressure may increase. Furthermore, the daily Relative Strength Index (RSI) settled at 73.93, suggesting that the asset is overbought. It may be due for a pullback or consolidation. While bullish momentum is strong, caution is warranted.
Top Updated Crypto News
Momentum Check: Can XDC Network Charge Back to Its Recent Highs, or Is a Pullback in Play?
Disclaimer: The information on this page may come from third parties and does not represent the views or opinions of Gate. The content displayed on this page is for reference only and does not constitute any financial, investment, or legal advice. Gate does not guarantee the accuracy or completeness of the information and shall not be liable for any losses arising from the use of this information. Virtual asset investments carry high risks and are subject to significant price volatility. You may lose all of your invested principal. Please fully understand the relevant risks and make prudent decisions based on your own financial situation and risk tolerance. For details, please refer to
Disclaimer.
Articoli correlati
Bitcoin Rebounds From New Monthly Lows, Ethereum Reclaims $2K: Market Watch
Bitcoin experienced volatility with a dip to a monthly low followed by a rebound. Ethereum also marked gains, surpassing $2,050. Despite some altcoins struggling, the overall crypto market cap rose to over $2.4 trillion.
CryptoPotato33m fa
Bearish Analyst Expects BTC Rally Between $79,000 – $84,000 Before a Massive Dip to Lower Targets
Bearish analyst expects BTC rally between $79,000 – $84,000.
This is expected to be followed by a massive dip in BTC price.
The analyst expects BTC to bottom between $35,000 and $45,000.
The crypto market is near sure that the month of March will close in red, marking the sixth
CryptoNewsLand39m fa
Tether’s USDT Stablecoin Gears Up To Flip Ethereum In Market Cap
An ongoing event contract on Polymarket indicates Ethereum could lose its spot as the second-largest crypto by market cap this year.
Analysts expect Tether’s USDT stablecoin to overtake ETH’s overall valuation within the same period.
An ongoing event contract in Polymarket predicts Ethereum (ETH)
Blockzeit58m fa
Cardano’s Treasury Spent Millions While ADA Price Sinks – Community Demands Answers!
Cardano's recent drop to 13th place on CoinMarketCap has frustrated long-time holders, as the project struggles to recover its market cap. Community member Bobcorn criticizes treasury spending, arguing it benefits developers while investors suffer losses. The divide persists, with some supporting infrastructure investments for future growth, while others see them as wasteful during poor performance.
CaptainAltcoin1h fa
Bitcoin Faces Extended Weakness Below Key Cost Basis
Bitcoin struggles below the $72.5K realized price, indicating resistance and prolonged bearish sentiment. Repeated rejections at $71K and a drop to $66K demonstrate strong selling pressure. Indicators suggest fragile recovery, with risks of further declines if support fails.
CryptoFrontNews1h fa
加密市場量能跌回2022年熊市水準,ETH成交量降幅超BTC、Gas費創歷史低點
加密市場週平均成交量跌至900億美元,較均值下降7%,顯示活躍度下降至2022年熊市水平;以太坊Gas費降至歷史低位,反映鏈上活動萎縮。比特幣與以太坊成交量皆低於均值,資金費率回升但仍在低分位。市場目前處於靜默狀態,缺乏明確催化劑。
動區BlockTempo1h fa
