 Trusted Editorial content, reviewed by leading industry experts and seasoned editors. Ad Disclosure
Bitcoin is entering a decisive moment as selling pressure intensifies and uncertainty continues to grip the market. Bulls are struggling to reclaim higher levels, and each failed rebound reinforces the prevailing downtrend. With momentum weakening across spot and derivatives markets, investors are increasingly questioning whether BTC can stabilize before more serious structural damage occurs.
Trusted Editorial content, reviewed by leading industry experts and seasoned editors. Ad Disclosure
Bitcoin is entering a decisive moment as selling pressure intensifies and uncertainty continues to grip the market. Bulls are struggling to reclaim higher levels, and each failed rebound reinforces the prevailing downtrend. With momentum weakening across spot and derivatives markets, investors are increasingly questioning whether BTC can stabilize before more serious structural damage occurs.
According to a report by Darkfost, the situation is especially difficult for short-term participants. With a realized price of $113,692, the BTC 1–3 month cohort is now experiencing the largest percentage loss of this entire cycle.
Related Reading: Ethereum Trading Volume Hits $375B In November As ETF Activity Surges – DetailsThis analysis focuses exclusively on the spot market, isolating a group of investors known for more speculative behavior and faster reaction times. Because these holders typically enter during strong momentum phases, their capitulation or continued holding often signals pivotal shifts in market structure.
The deep losses within this cohort reveal how aggressively the market has reversed and underscore the mounting pressure on shorter-term players. As Bitcoin approaches critical support levels, the behavior of these investors may determine whether the current correction stabilizes — or accelerates into a broader downturn.
Short-Term Holder Capitulation Often Signals Bottom Formation
Darkfost highlights that the 1–3 month Bitcoin holder cohort has now spent nearly two weeks sitting on average unrealized losses between 20% and 25%. Historically, this type of drawdown among short-term participants has tended to occur near cyclical bottom formation.
These traders typically react quickly to volatility, and when their losses reach this depth, they are pushed into a critical decision point: sell and exit the market, or hold and endure further downside.
 Bitcoin On-Chain Trader Realized Price and Profit/Loss Margin | Source: CryptoQuantThroughout this cycle, similar phases of elevated losses have preceded major inflection points. Once a large portion of these speculative holders capitulates — a process that appears to have been unfolding in recent weeks — selling pressure usually begins to exhaust. This shift often creates an environment where accumulation becomes far more attractive for patient investors who track sentiment and realized-price dynamics.
However, Darkfost emphasizes that this pattern only holds if the long-term bullish trend remains intact. Structural on-chain indicators, broader demand trends, and long-horizon holder behavior continue to support the idea that Bitcoin’s macro trend has not been invalidated.
While volatility may persist in the short term, the alignment of capitulation signals with a still-intact long-term structure suggests that current levels could become an opportunity for strategic accumulation.
Related Reading: Bitmine Resumes Ethereum Accumulation: 14,618 ETH Bought in Latest Move
Bitcoin Tests Weekly Level as Market Searches for Higher-Timeframe Support
Bitcoin’s weekly chart shows the most significant corrective phase since the early stages of the cycle, with price falling sharply from the $120,000 region and now attempting to stabilize around the 100 SMA near $84,000–$85,000. This moving average has historically acted as a major structural support during bull markets, and BTC’s current interaction with it marks a critical juncture for the broader trend.
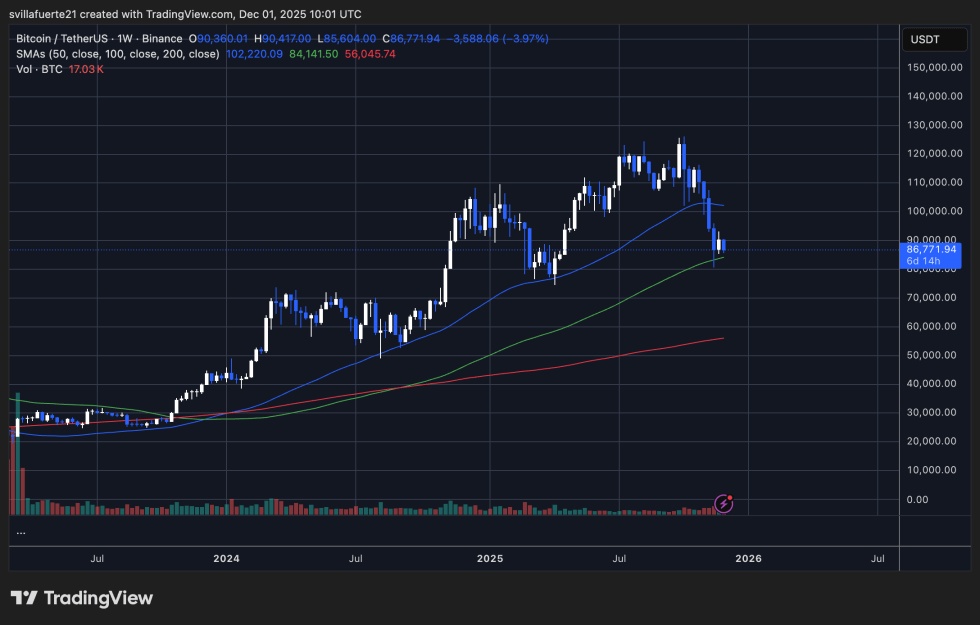 BTC testing key demand | Source: BTCUSDT chart on TradingView
The breakdown below the 50 SMA was a clear sign of weakening momentum, signaling that sellers have gained control of the higher-timeframe structure. However, the wick formed beneath the 100 SMA suggests that buyers are beginning to step in, attempting to defend this crucial zone. The reaction so far is constructive but not yet decisive — BTC needs a stronger weekly close above $90,000 to confirm stability.
BTC testing key demand | Source: BTCUSDT chart on TradingView
The breakdown below the 50 SMA was a clear sign of weakening momentum, signaling that sellers have gained control of the higher-timeframe structure. However, the wick formed beneath the 100 SMA suggests that buyers are beginning to step in, attempting to defend this crucial zone. The reaction so far is constructive but not yet decisive — BTC needs a stronger weekly close above $90,000 to confirm stability.
Related Reading: Coinbase Wallet Rebalancing Creates False $68B LTH Distribution Signal – Details
Volume has increased during the decline, indicating forced selling and capitulation rather than organic trend reversal. Historically, pullbacks into the 100 SMA often precede medium-term bottoms within a long-term bullish market, but continuation depends on whether BTC can avoid a sustained weekly close below this level.
Featured image from ChatGPT, chart from TradingView.com
![]() Editorial Process for bitcoinist is centered on delivering thoroughly researched, accurate, and unbiased content. We uphold strict sourcing standards, and each page undergoes diligent review by our team of top technology experts and seasoned editors. This process ensures the integrity, relevance, and value of our content for our readers.
Editorial Process for bitcoinist is centered on delivering thoroughly researched, accurate, and unbiased content. We uphold strict sourcing standards, and each page undergoes diligent review by our team of top technology experts and seasoned editors. This process ensures the integrity, relevance, and value of our content for our readers.
Disclaimer: The information on this page may come from third parties and does not represent the views or opinions of Gate. The content displayed on this page is for reference only and does not constitute any financial, investment, or legal advice. Gate does not guarantee the accuracy or completeness of the information and shall not be liable for any losses arising from the use of this information. Virtual asset investments carry high risks and are subject to significant price volatility. You may lose all of your invested principal. Please fully understand the relevant risks and make prudent decisions based on your own financial situation and risk tolerance. For details, please refer to
Disclaimer.
