Tida

vip
Futures Trading Strategist
Market Analyst
Airdrop Hunter
No content yet
  • Reward
  • Comment
  • Repost
  • Share
  • Reward
  • Comment
  • Repost
  • Share
  • Reward
  • Comment
  • Repost
  • Share
  • Reward
  • Comment
  • Repost
  • Share
HighAmbition
#CanaryFilesSpotPEPEETF
🚨 Canary Spot PEPE ETF
1. What Actually Happened?
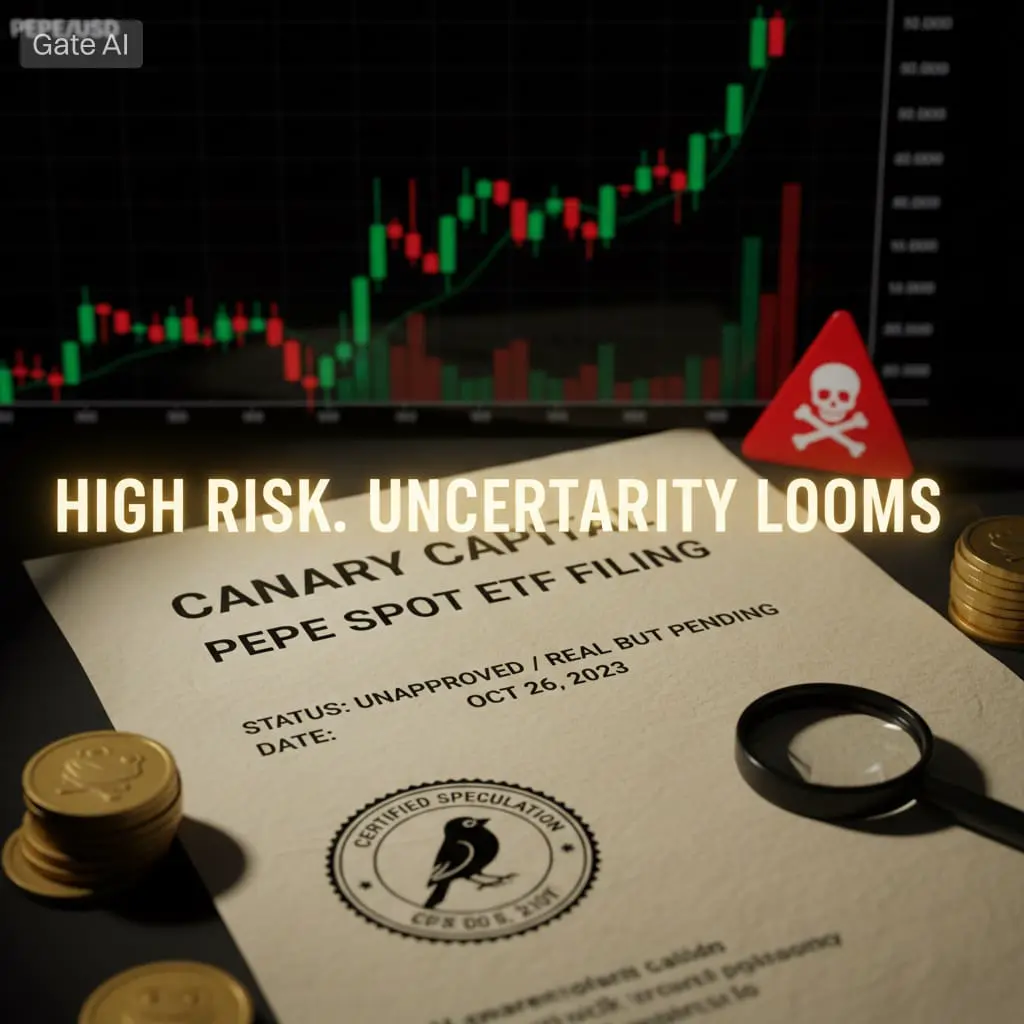
On April 8, 2026, Canary Capital, a U.S.-based asset management firm, officially filed a Form S-1 registration statement with the U.S. Securities and Exchange Commission (SEC) for a proposed Spot PEPE ETF, officially named the “Canary PEPE ETF.”
This marks a historic moment because it is the first serious attempt to launch a regulated exchange-traded fund directly linked to a meme coin in the United States. The filing represents the beginning stage of regulatory review and does not yet confirm approval or launch.
2. Who Is Canary Capital?
Canary Capital is an established asset management firm that has already filed and managed multiple regulated crypto ETF products linked to major digital assets, including XRP, Solana, Hedera (HBAR), and SEI.
Because of this background, their filings are taken seriously by the market, as they have experience navigating SEC regulatory frameworks for crypto-based financial products. Their involvement increases the credibility of the filing, although it does not guarantee approval.
3. What Is a Spot PEPE ETF?
A Spot PEPE ETF is a regulated financial product that would directly hold actual PEPE tokens on-chain and track their real-time market price.
If approved, it would allow traditional investors such as pension funds, hedge funds, and retail stock traders to gain exposure to PEPE through standard brokerage accounts without using crypto wallets or exchanges.
In simple terms, it transforms PEPE from a purely crypto-native asset into a tradable financial instrument within traditional financial markets.
4. PEPE Current Market Position
PEPE is currently trading around $0.000003594 with short-term gains of approximately +2.86% in the last 24 hours and +6.58% over the past 30 days. However, it remains down around -37% over the past 90 days and approximately 85% below its all-time high.
Technical indicators show a mixed structure. The short-term trend appears bullish with moving averages aligned positively, while longer-term indicators suggest overbought conditions and weakening volume. This indicates that the current upward movement may face short-term resistance or consolidation.
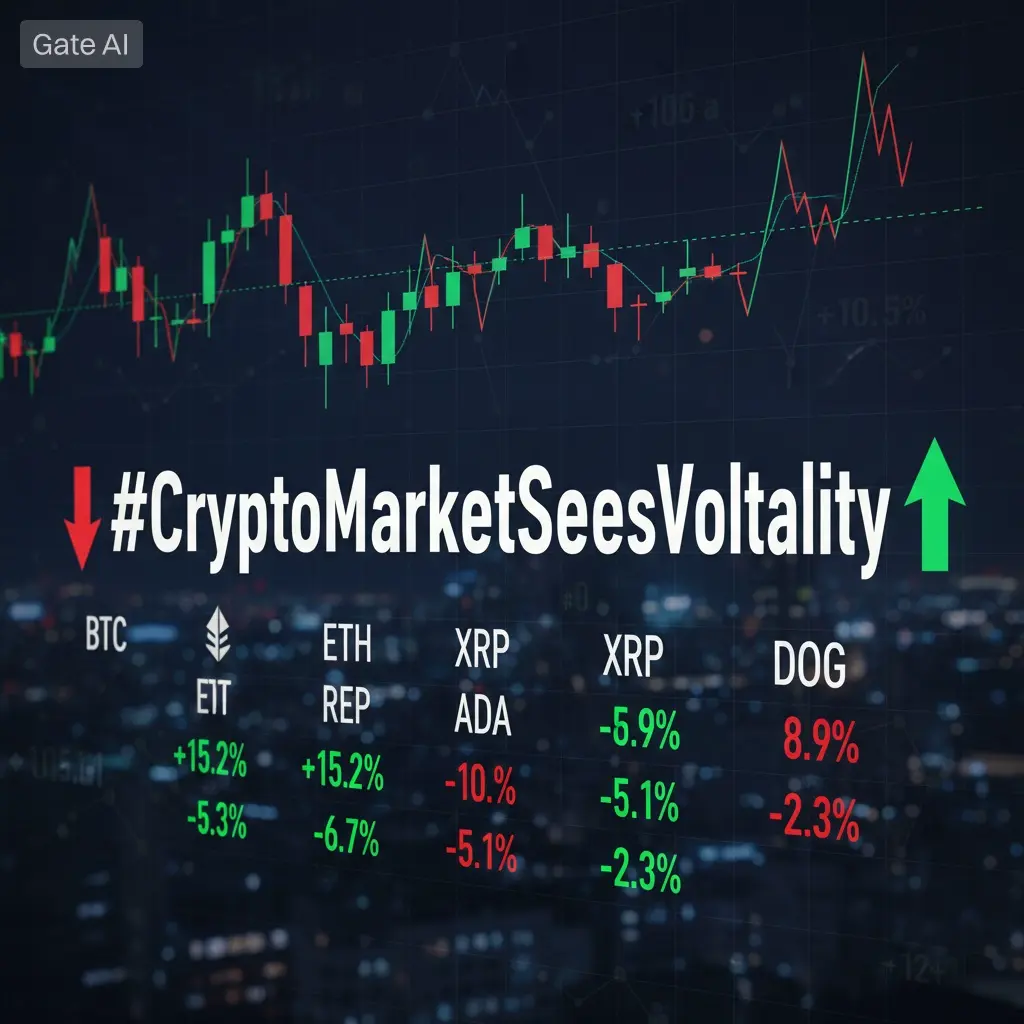
5. Market Sentiment Overview
Following the ETF filing announcement, market sentiment shifted strongly positive, with approximately 86% bullish sentiment compared to 14% bearish.
Social engagement increased more than four times compared to previous periods, driven mainly by retail traders. However, institutional commentary and major influencer participation remain limited, suggesting that the narrative is still in its early and speculative stage.
6. Price Impact Analysis
The ETF filing introduces multiple potential price scenarios for PEPE depending on market reaction and regulatory progress.
In the immediate phase, price movement has remained relatively muted, showing that the market is still uncertain and not fully pricing in approval probability.
In a short-term speculative phase, PEPE could experience gains in the range of 15% to 60%, driven primarily by retail FOMO and increased social media attention.
If stronger regulatory signals or approval expectations develop, more aggressive upside movements between 80% and 150% or higher could occur due to heightened speculative inflows.
However, once speculative excitement fades, historical patterns suggest that PEPE could experience corrections in the range of 20% to 50% as traders take profits and momentum slows.
If the ETF is eventually approved and launched, PEPE could establish a higher long-term price range supported by structural demand, although volatility would remain extremely high.
7. Liquidity Impact
If ETF-related momentum continues, PEPE liquidity could expand significantly.
Liquidity growth estimates suggest a potential increase of 40% to 150% during strong hype phases, driven by new capital inflows and increased trading activity.
This would result in deeper order books, improved execution efficiency, and reduced slippage for large trades. It would also increase participation from larger market players who were previously absent.
However, at this stage, liquidity expansion remains mostly narrative-driven rather than confirmed through sustained institutional inflows.
8. Trading Volume Impact
ETF-related developments typically cause major increases in trading volume.
PEPE could experience volume surges ranging from 2x to 8x during peak hype periods, particularly in both spot and derivatives markets.
Futures and perpetual trading activity is expected to increase significantly as traders attempt to capitalize on volatility and short-term price movements.
However, these volume spikes are usually temporary and tend to normalize after the initial excitement fades.
9. Broader Market and Structural Impact
The filing has implications beyond PEPE itself. It signals that meme coins are gradually being considered within regulated financial frameworks, which represents a shift in how traditional finance views digital assets.
If approved, it would open institutional access to PEPE, allowing hedge funds, pension funds, and wealth managers to participate in the market.
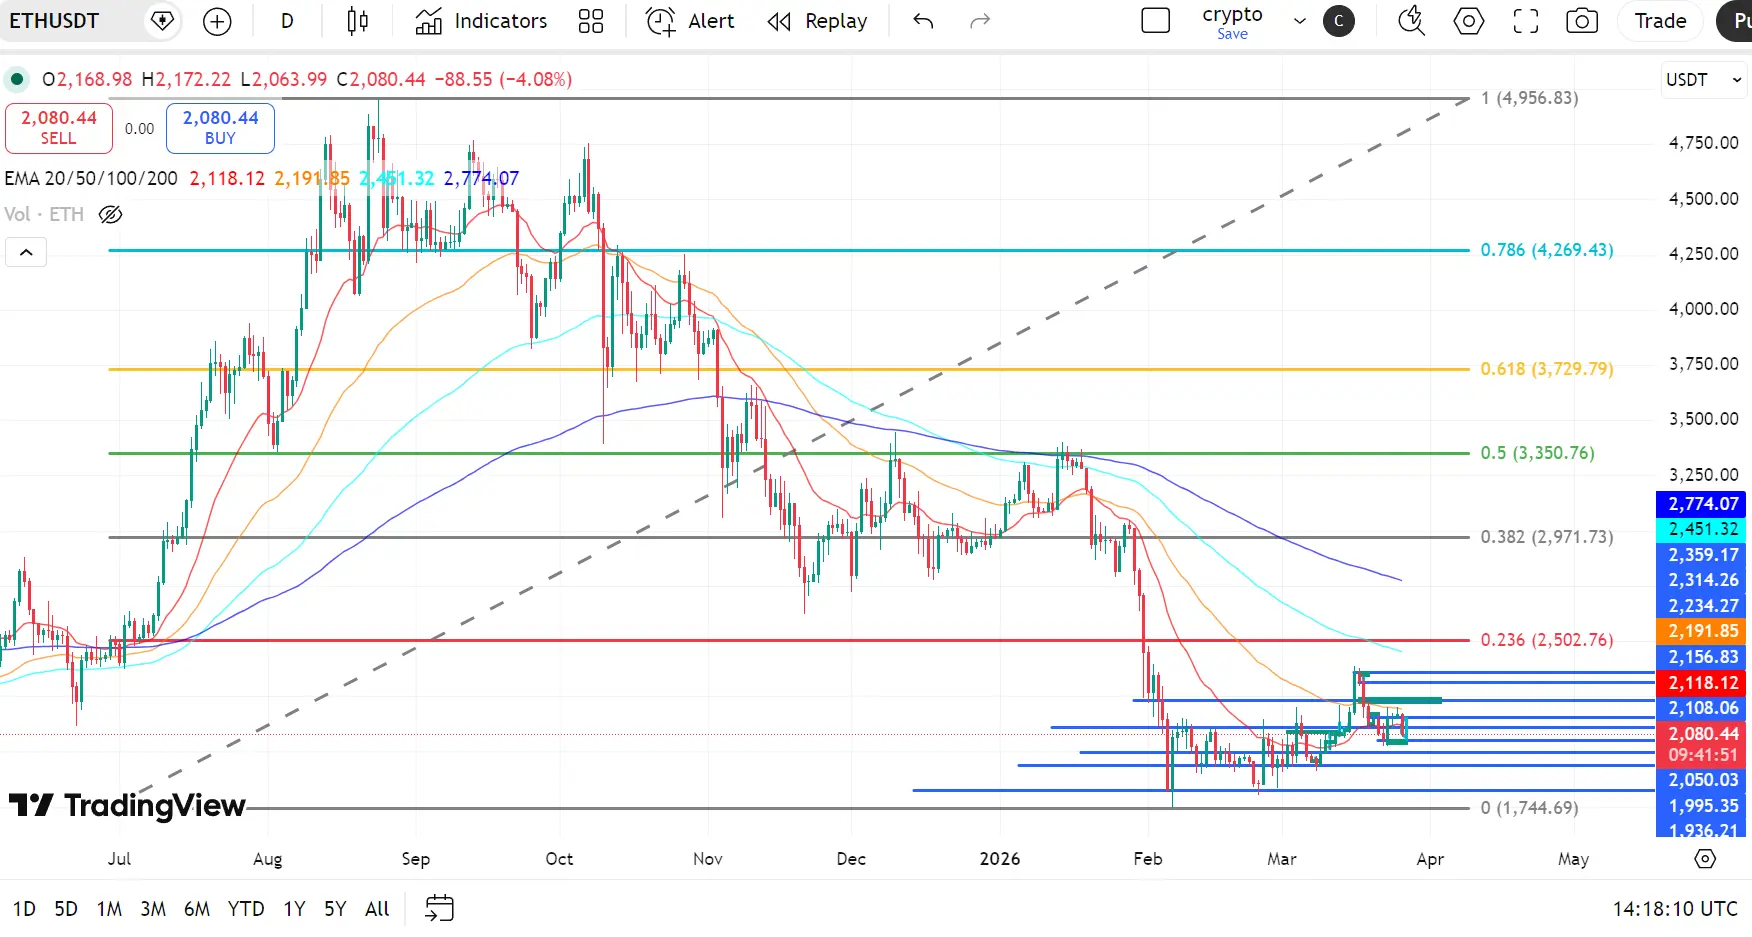
It could also increase activity on the Ethereum network since PEPE operates on Ethereum, potentially boosting on-chain activity and reinforcing Ethereum’s role as a settlement layer for tokenized assets.
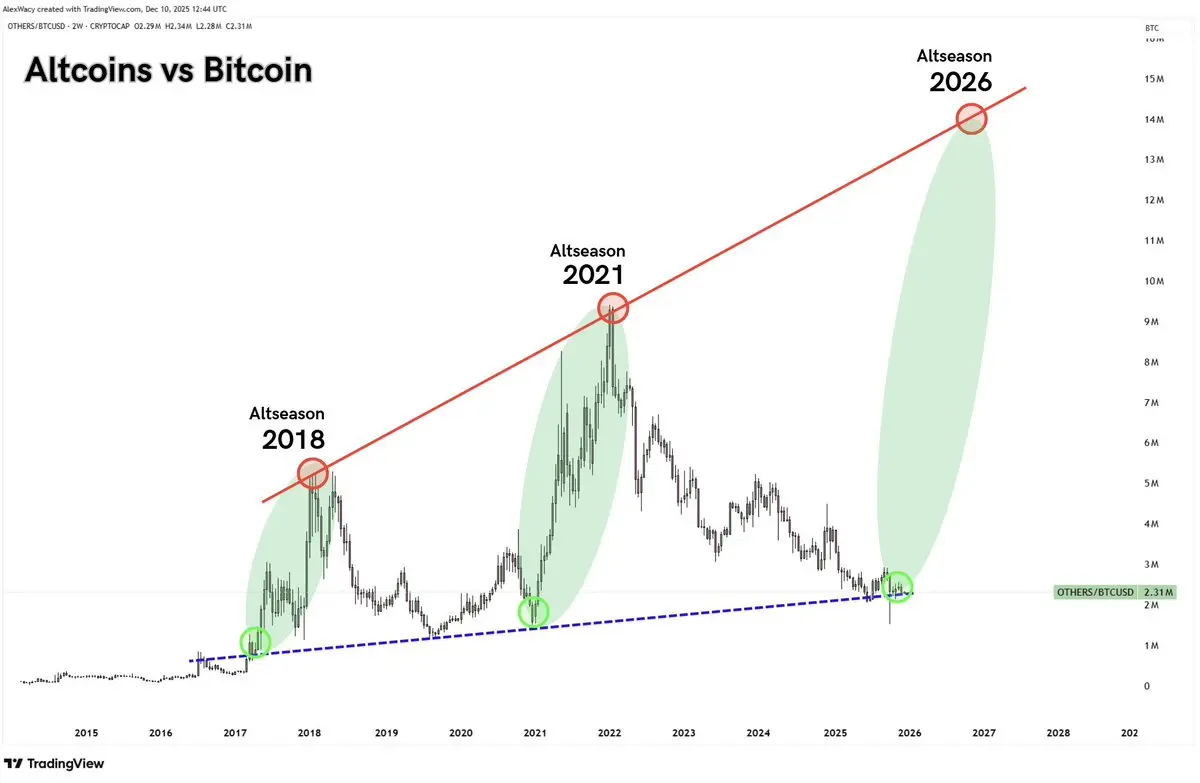
More broadly, this filing reflects a continued evolution in crypto ETFs, moving from Bitcoin and Ethereum toward higher-risk altcoins and now meme-based assets.
10. Risks and Limitations
Despite the hype, several major risks remain.
The SEC may reject or delay the ETF due to concerns about volatility, lack of utility, and investor protection.
PEPE remains a highly speculative asset with no fundamental valuation model or intrinsic cash flow.
Market manipulation risk is also elevated due to concentrated token holdings and historical trading behavior.
Institutional demand for meme-based assets remains uncertain, and approval precedent for such a product does not yet exist.
Final Conclusion
The Canary Spot PEPE ETF filing is a real regulatory development that introduces the possibility of traditional financial exposure to a meme coin for the first time.
If market conditions and regulatory outcomes align positively, PEPE could experience significant short-term price surges of 15% to 150%, liquidity expansion of 40% to 150%, and trading volume increases of 2x to 8x during hype cycles.
However, the filing does not guarantee approval, institutional demand remains uncertain, and PEPE continues to be a highly speculative and volatile asset driven primarily by sentiment rather than fundamentals.
Overall, this development represents a major step in the financialization of crypto markets, but it also highlights the extreme risk profile of meme-based assets in regulated financial environments.
repost-content-media
  • Reward
  • 1
  • Repost
  • Share
Tida:
To The Moon 🌕
#CanaryFilesSpotPEPEETF
🚨 Canary Files Spot PEPE ETF — Meme Coin Mania Meets Institutional Finance as a Bold Filing Attempts to Bridge Viral Crypto Culture With Regulated Market Structures, Raising Critical Questions About Legitimacy, Liquidity Sustainability, and the Future of Speculative Assets Entering Traditional Investment Channels 🔥📊
The recent move by Canary Capital to file for a spot ETF centered around PEPE has instantly ignited debate across both the crypto community and traditional financial circles, marking a moment that many are calling either groundbreaking or controversial d
BTC5,09%
post-image
  • Reward
  • 1
  • Repost
  • Share
Tida:
2026 GOGOGO 👊
can’t stop thinking about this chart 😭
if it continues like this
biggest altseason in history is coming
post-image
  • Reward
  • 1
  • Repost
  • Share
MasterChuTheOldDemonMasterChu:
Just go for it 👊
  • Reward
  • 2
  • Repost
  • Share
MasterChuTheOldDemonMasterChu:
Just go for it 👊
View More
#CryptoMarketSeesVolatility When Fear Rules The Market Smart Money Starts Watching.
April 2026 has opened with a wave of uncertainty across the crypto market and if you have been watching charts lately you already know this is not just a minor dip this is a full scale emotional test for investors.
The market is not just moving it is reacting and behind every price drop there is a story of fear hesitation and opportunity lets break it down.
The crypto market right now feels heavy almost every major asset is under pressure prices are slipping support levels are being tested and traders are becom
BTC5,09%
post-image
  • Reward
  • 6
  • Repost
  • Share
MasterChuTheOldDemonMasterChu:
坚定HODL💎
View More
#PredictToWin1000GT
The total crypto market capitalization is currently sitting around $2.34 trillion, with a modest recovery of about 1-2% in the last 24 hours. The 24-hour trading volume has climbed above $78-85 billion, which still points to decent liquidity even if things feel choppy. Bitcoin is trading in the $66,000 – $67,500 range after some recent swings, while Ethereum is hovering near $2,000 – $2,070, showing small daily moves of 1-4% depending on the hour. The overall mood remains cautious; short-term volatility is elevated, but we’re not in freefall territory.
The dominant short-t
BTC5,09%
ETH8,14%
SOL6,08%
XRP2,93%
post-image
post-image
  • Reward
  • 2
  • Repost
  • Share
MasterChuTheOldDemonMasterChu:
Just go for it 👊
View More
BTC Technical Outlook: Range Compression Below 0.236 Fib as Breakout Decision Nears
Bitcoin remains within a broader downtrend structure, but recent price action shows short-term stabilization and range compression after a sharp decline into the $60K zone.
Currently, BTC is trading around $70K–$71.5K, consolidating just below a key resistance cluster, suggesting the market is preparing for its next directional move.
EMA Structure (Bearish with Early Recovery Signs)
20 EMA: ~$70.3K
50 EMA: ~$72.1K
100 EMA: ~$78.0K
200 EMA: ~$86.2K
Price is holding around the 20 EMA, indicating short-term suppor
BTC5,09%
post-image
post-image
  • Reward
  • 3
  • Repost
  • Share
MasterChuTheOldDemonMasterChu:
Just go for it 👊
View More
🎯 Possible rewards include:
• $500 Position Trial Fund
• 1,000 PEPE
• $1 – $5 trading fee rebate vouchers
• 10 Lucky Bags
• 10g Gold Bar
• VIP +1
• Gate T-shirt and Gate × RedBull gift box
💡 Every 300 Growth Points = 1 Lucky Draw chance
⏰ Event Period:
March 23 – April 3 (UTC)
PEPE7,07%
post-image
  • Reward
  • 3
  • Repost
  • Share
MasterChuTheOldDemonMasterChu:
Just go for it 👊
View More
Crypto_Buzz_with_Alex
The Gate Square Creator Leaderboard is live — and the prize pool is real.
This is a direct competition. Post quality content. Move up the rankings. Share in 1,500 USDT in rewards.
Here is how it works:
The prize structure.
Top 10 Creators on the leaderboard share 1,050 USDT
5 Rising Stars — new or returning creators — each receive 30 USDT (150 USDT total)
Additional rewards for traffic promotion boosts go to top-performing creators
What gets rewarded.
Quality. Insight. Engagement. Every post that generates genuine interaction — views, comments, shares, reactions from the Gate Square community — moves your ranking. This is not a lottery. The leaderboard is ranked. The creators who put in the work and produce content worth reading consistently outrank those who do not.
What the leaderboard actually measures.
Content that earns attention from a crypto-native audience. Market analysis that cuts through noise. Trade ideas with clear reasoning. Hot takes that hold up under scrutiny. Coverage of events that matter — DeFi exploits, mining difficulty adjustments, institutional accumulation, macro shocks — told in a way that gives your audience something actionable.
The creators who dominate leaderboards in crypto communities are not the loudest. They are the most consistently useful.
Why this matters beyond the prize pool.
The Gate Square Creator Leaderboard is part of a broader creator incentive structure that has been building across the platform. Top creators earn token rewards, exclusive Gate merchandise, and platform promotion — meaning the prize pool is the floor, not the ceiling. Visibility on Gate Square means visibility to one of the most active crypto trading communities globally.
If you have been posting and not tracking your ranking, now is the time to start. If you have been waiting to post, the leaderboard is open.
Gate Square is at gate.com. Start posting.
#CreatorLeaderboard #GateSquare #Gate13thAnniversaryGlobalCelebration #Gateio
repost-content-media
  • Reward
  • 2
  • Repost
  • Share
MasterChuTheOldDemonMasterChu:
Just go for it 👊
View More
🚨 JUST IN 💰
Strategy has acquired 1,031 $BTC for approximately $76.6 million at an average price of about $74,326 per Bitcoin.
As of March 22, 2026, Strategy holds 762,099 BTC, purchased for approximately $57.69 billion at an average price of about $75,694 per Bitcoin.
$BTC ‌
BTC5,09%
post-image
post-image
  • Reward
  • 1
  • Repost
  • Share
MasterChuTheOldDemonMasterChu:
坚定HODL💎
Bitcoin Analysis
$BTC once again failed to close the weekly candle above the $72K range high, which is a concern. That was one of the main reasons I decided to close my long position, along with the second factor being the ongoing war between the United States, Israel, and Iran.
I’ve made it clear that a range is forming, and I expect Bitcoin to continue trading sideways between $54K and $72K. This phase is not bullish. It is a preparation phase for what comes next. My expectation remains the same: after this consolidation, Bitcoin is likely to break down from the range and move toward $44K–$
BTC5,09%
post-image
  • Reward
  • Comment
  • Repost
  • Share
Tida
#BitcoinSupportAndResistanceAnalysis
#Bitcoin Support and Resistance Analysis (March 22, 2026) What to Expect Next
As of today, Bitcoin is not making random moves; it is compressing energy within a defined range. This compression means the market is taking a pause neither trending strongly upward nor breaking sharply downwar but quietly building tension. In markets, compression almost always leads to expansion: after a period of sideways consolidation, a significant directional move tends to follow. The key question now is which way that expansion will happen.
At the current price level around $70,000, the market is sitting in what traders call a decision zone. This means that neither buyers nor sellers have taken full control yet. Instead, the market is being shaped by positioning, order flow, and liquidity dynamics. In simple terms, the market is no longer about immediate direction; it is about who gets caught off guard first.
Market Context What is Really Happening
Right now, Bitcoin is not in a clear uptrend or downtrend. Instead, it is moving sideways within a range, creating frustration for traders who are looking for clear signals. In this neutral zone:
Retail traders often enter and exit too early
Large, disciplined traders accumulate or reduce positions quietly
Stop orders and liquidity clusters build above and below price
Short-term volatility spikes without strong directional continuation
This range is where weak conviction gets exposed, and only traders with patience tend to perform well.
Most losses in these phases occur not at breakout points, but before the breakout, as traders mis-time entries or react emotionally to price swings.
Major Support Levels Where the Market Might Hold
These support zones are areas where buyers have historically shown interest and may step in again:
$69,800 – $70,000
This is the immediate support area. Price is currently testing this zone repeatedly. If it holds, it means bulls are defending this level and buyers remain present.
$68,900
Previously, buyers showed strength at this level, so it is still meaningful. If price revisits here, reactions could occur but a bounce here does not guarantee a bottom.
$67,800 – $68,200
This deeper support range represents the next structural level. If price reaches this zone, the narrative shifts from “minor pullback” to a potential deeper retracement.
$66,500 and below
This is a more bearish threshold. A sustained break below this level would indicate loss of recent bullish structure and could lead to a broader downside phase.
Major Resistance Levels — Where Supply Is Strong
These resistance zones represent areas where sellers have shown pressure in the past:
$70,800
This is the near-term resistance zone. Price has struggled to maintain above this level, suggesting hesitance from bulls.
$71,500
This is the key breakout trigger level. If Bitcoin breaks above this with conviction and volume, short-term structure turns bullish and momentum increases. A break here can trigger fresh buying and open the path toward higher targets.
$73,000 – $73,500
This is a medium-term resistance area where sellers have previously dominated price reactions. The market will test whether selling pressure still exists at these levels.
$75,000 and above
This is a major macro resistance area. Breaking above this would revalidate broad bullish control and increase confidence in continued upward expansion.
Volume Insights Why This Matters
The drop from higher price levels earlier has been accompanied by strong volume, suggesting distribution where larger holders reduce positions. The current consolidation phase, however, is occurring on low volume.
Low volume during a sideways range means:
Traders are waiting for a signal before committing
Market participants are cautious rather than aggressive
Liquidity is building, but not yet being consumed
This sets the stage for a strong move once a breakout direction becomes clear. High volume expanding along with price movement is the confirmation traders look for when judging whether the breakout or breakdown is real.
Liquidity Landscape What Price Moves Toward
In market structure, prices tend to move toward clusters of liquidity:
Above the current range, there are stop orders from short traders and orders from breakout players looking to buy
Below the range, there are stop losses from long traders and potential panic sales
The market does not move randomly; it first targets areas where orders are stacked. The side that gets activated first often determines the immediate directional move.
Bullish Scenario What Needs to Happen
For bulls to gain control and steer the market upward:
Bitcoin must hold above $70,000 support consistently
It must then break above $71,500 with strong volume
Once that breakout is confirmed, the next target becomes $73,000+
A clear move past $75,000 would validate a broader continuation of the uptrend
This scenario would suggest that buyers are stronger and that the market is ready to expand upward.
Bearish Scenario What Could Trigger Downside
For bears to take control and push price lower:
Bitcoin must break below $69,800 with conviction
A sustained move below $69,000 would break the immediate support
Lower targets would become $68,000 and $67,000 support ranges
A deeper reaction could unfold toward $66,500 or lower
This scenario would show weakening demand and give bears the momentum to push price downward.
Neutral and Smart Trading Strategy
This neutral range environment demands patience and clarity:
Avoid entering trades in the middle of the range, where signals are mixed
Only act when price decisively breaks above resistance or below support
Larger traders and institutions often wait for confirmation before increasing exposure
For smart traders, the edge is not in guessing direction, but in waiting for clear market structure confirmation.
Psychological Reality Why Traders Get Trapped
This phase psychologically frustrates many traders because:
Price swings appear directional but fail to sustain
Breakouts happen but quickly reverse
Impulsive traders lose capital by reacting early
The real advantage comes to those who remain patient and refrain from forcing trades.
Short‑Term Outlook What to Expect Next
In the immediate future:
The market is likely to remain in this range until a breakout or breakdown is confirmed
Breakout above $71,500 with volume signals upward expansion
Breakdown below $69,800 with volume signals downward expansion
Everything between these levels remains market noise
Final Thought The Key Edge
The most important insight today is this:
The market isn’t random it is waiting. The next big move will come when the range resolves.
The real edge is not in guessing which direction it will be; the edge is in waiting for confirmation before acting, while many others trade prematurely and get caught on the wrong side.
Whether you are a short-term trader or a longer-term investor, the discipline of waiting for clear structure and confirmation will always outperform emotion-based decisions in markets like this.
In the coming days, watch:
Break and hold above $71,500
Or break and hold below $69,800
These are the levels that will define Bitcoin’s next meaningful move.
repost-content-media
  • Reward
  • Comment
  • Repost
  • Share
#BitcoinSupportAndResistanceAnalysis
#Bitcoin Support and Resistance Analysis (March 22, 2026) What to Expect Next
As of today, Bitcoin is not making random moves; it is compressing energy within a defined range. This compression means the market is taking a pause neither trending strongly upward nor breaking sharply downwar but quietly building tension. In markets, compression almost always leads to expansion: after a period of sideways consolidation, a significant directional move tends to follow. The key question now is which way that expansion will happen.
At the current price level aroun
BTC5,09%
post-image
  • Reward
  • 1
  • 1
  • Share
Tida:
2026 GOGOGO 👊
🚨 JAPAN IS ABOUT TO TRIGGER THE BIGGEST CARRY TRADE COLLAPSE IN 30 YEARS. 🚨
Here is what is happening right now.
The Bank of Japan held rates today at 0.75%.
But one board member DISSENTED.
He voted to hike to 1% immediately.
That single vote is a WARNING.
Because in April, the full board is expected to follow him.
The damage when they do:
💀 $4 TRILLION in yen carry trade positions — AT RISK
💀 Bitcoin dropped 26% after the July 2024 BOJ hike
💀 Bitcoin dropped 31% after the January 2025 BOJ hike
💀 USD/JPY could drop 500-800 PIPS in MINUTES on the announcement
💀 Japan debt servicing costs
BTC5,09%
post-image
[The user has shared his/her trading data. Go to the App to view more.]
  • Reward
  • 2
  • Repost
  • Share
MasterChuTheOldDemonMasterChu:
Good luck and prosperity 🧧
View More
BTC Technical Outlook: Rejection at Resistance Keeps Market in Controlled Downtrend
Bitcoin remains structurally bearish on the higher timeframe, but short-term price action shows consolidation after a relief bounce from the $60K region. The recent rejection near resistance suggests that sellers are still in control, at least for now.
Currently, BTC is trading around $70.4K, sitting just below a key resistance cluster.
EMA Structure (Bearish Alignment)
20 EMA: $70,577
50 EMA: $72,763
100 EMA: $79,028
200 EMA: $87,253
Price is struggling below the 20 & 50 EMA, indicating weak short-term momentu
BTC5,09%
post-image
  • Reward
  • 2
  • Repost
  • Share
MasterChuTheOldDemonMasterChu:
Stay strong and HODL💎
View More
#BitcoinSupportAndResistanceAnalysis
Bitcoin Support and Resistance Analysis Current Technical Market Breakdown
As of today, Bitcoin (BTC) is trading in the range of $74,050 – $74,150, showing renewed momentum after recent market fluctuations. This range has become a critical pivot zone, where short-term decisions by traders could dictate whether BTC pushes higher or consolidates. Understanding these support and resistance levels is crucial for anyone looking to navigate the Bitcoin market effectively.
Understanding Support and Resistance in BTC Price Action
In technical analysis, support lev
BTC5,09%
post-image
Falcon_Official
#BitcoinSupportAndResistanceAnalysis
Bitcoin Support and Resistance Analysis Current Technical Market Breakdown
As of today, Bitcoin (BTC) is trading in the range of $74,050 – $74,150, showing renewed momentum after recent market fluctuations. This range has become a critical pivot zone, where short-term decisions by traders could dictate whether BTC pushes higher or consolidates. Understanding these support and resistance levels is crucial for anyone looking to navigate the Bitcoin market effectively.
Understanding Support and Resistance in BTC Price Action
In technical analysis, support levels are price points where buying pressure tends to prevent further declines, while resistance levels are zones where selling pressure slows or reverses upward movement. These levels are tested repeatedly and are key indicators of market sentiment. BTC’s behavior around these zones often signals whether a trend will continue, pause, or reverse.
Immediate Support Zones
Around the current trading range near $74,100, there are several important support levels:
$70,000 Support: This psychological and technical support has historically acted as a cushion during pullbacks. Buyers have consistently stepped in around this level, creating a strong foundation for rebounds.
$68,000–$70,000 Zone: A broader demand area where prior consolidation has occurred. This zone often provides a safety net in case of deeper corrections and is watched closely by both retail and institutional traders.
Maintaining these support zones is vital for BTC to sustain momentum. A drop below $70,000 could trigger further downside, but so far, BTC has shown resilience above $68,000.
Key Resistance Levels
BTC faces notable resistance levels above the current price:
$74,500–$75,000: The immediate resistance cluster. Sellers historically emerge in this zone, making it a critical hurdle for short-term bullish continuation.
$75,000–$76,000: A major resistance ceiling. A successful break above this area could open the path toward new short-term highs, attracting more buying activity.
Overcoming these resistance zones is essential for BTC to maintain its upward trajectory. Failure to do so may result in sideways movement or short-term consolidation.
Current Market Conditions Supporting the Analysis
Several factors currently support BTC’s technical strength:
Short Liquidations: Traders betting on declines have been forced to close positions, fueling upward momentum.
Institutional Flows: Inflows into Bitcoin ETFs have added buying pressure, reflecting renewed confidence from larger market participants.
Momentum Indicators: RSI and other momentum tools show moderate bullish pressure, suggesting room for short-term upside without immediate overextension.
These elements combine to create a technically constructive environment, though resistance levels above remain significant.
Why the $74,000 Zone Matters
The range around $74,000–$75,000 is pivotal. It represents the intersection of strong support and approaching resistance:
Holding Above $74,000: Indicates buyer commitment and increases the likelihood of testing higher resistance levels.
Struggling at Resistance: Suggests potential range-bound behavior, where BTC may oscillate between support and resistance zones before a decisive breakout.
This zone is a key barometer for short-term market sentiment and can dictate the next directional move.
Technical Tools for Traders
Traders often rely on several technical tools to analyze these levels:
Fibonacci Retracement: Identifies potential reversal zones based on prior trends.
Pivot Points: Helps determine intraday and short-term trend bias.
Momentum Indicators: Tools like RSI and MACD assess overbought or oversold conditions, indicating trend strength and potential reversals.
Combining these tools provides a more holistic view of where BTC might find support or encounter resistance.
Short-Term and Mid-Term Scenarios
Bullish Scenario:
If BTC sustains above $74,000 and breaks $75,000–$76,000 resistance, the market may see accelerated buying, potentially driving prices toward the next technical targets above $77,000.
Bearish Scenario:
If BTC fails to hold the $74,000 zone and falls below $70,000, it could enter a deeper retracement toward $68,000 or lower. Such a move could trigger increased selling and short-term consolidation.
Trading Takeaways
Support Levels to Watch: $70,000 and $68,000.
Resistance Levels to Watch: $74,500–$75,000 and $75,000–$76,000.
Market Drivers: Short liquidations, ETF inflows, and momentum indicators all favor cautious optimism.
Next Moves: A clear break above resistance could signal further upside, while failure to hold support may lead to consolidation.
Conclusion
Bitcoin’s trading around $74,000 is currently defined by a delicate balance between buyer and seller pressures. Traders should focus on these key support and resistance zones, closely monitor momentum indicators, and consider both technical and fundamental factors such as institutional flows and market sentiment.
The next few days will be crucial in determining whether BTC can sustain bullish momentum toward $76,000 and beyond, or if a retracement toward $70,000–$68,000 is likely. Staying informed on these levels provides traders and investors with the best opportunity to navigate the market strategically.
repost-content-media
  • Reward
  • 1
  • Repost
  • Share
Tida:
amazing😍😍
  • Pin