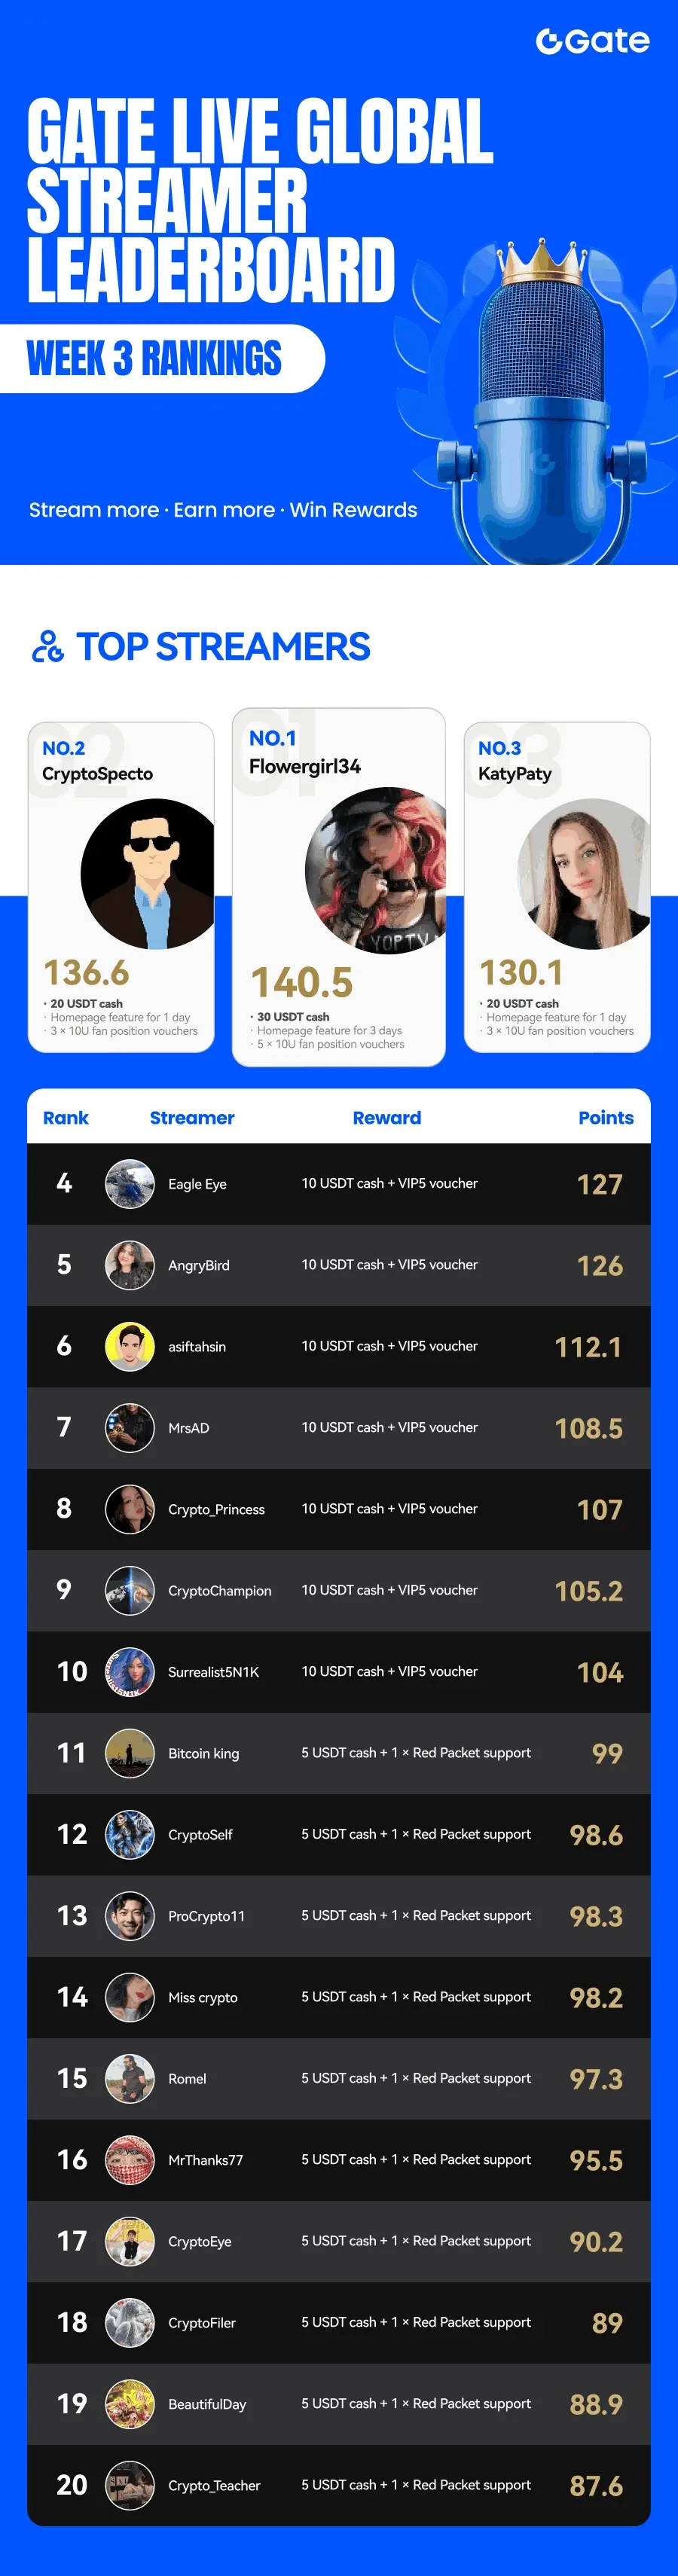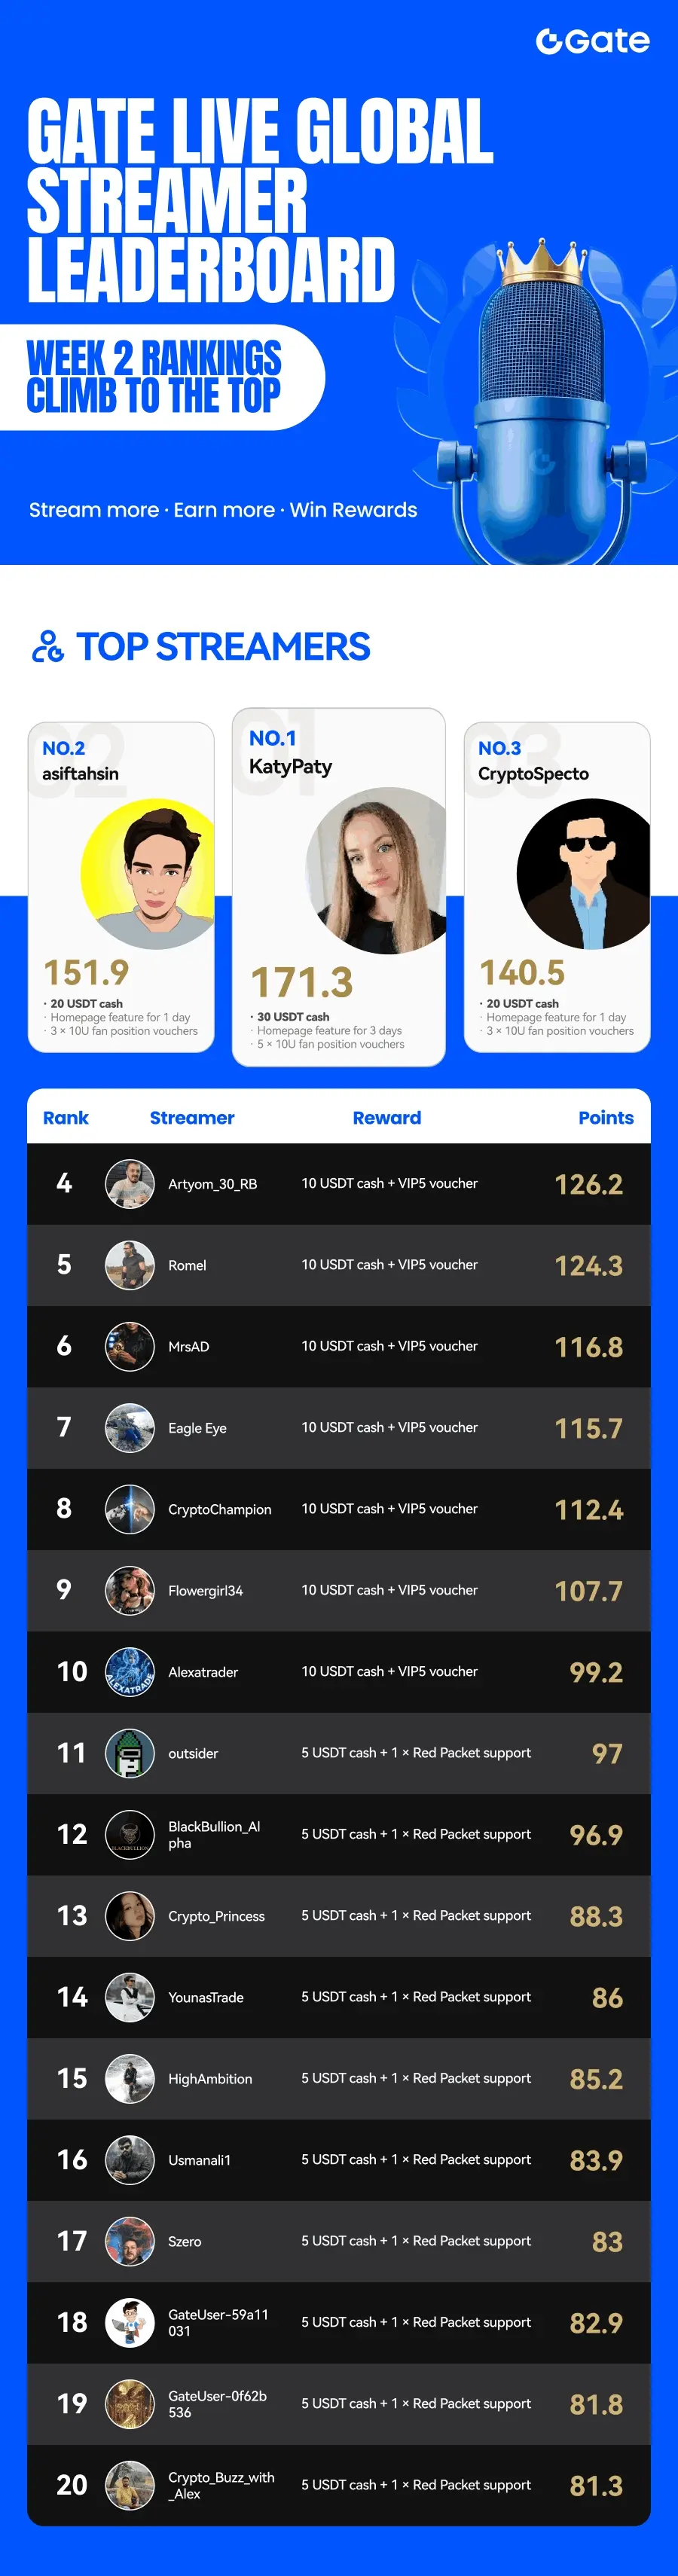
🔥 Gate Live Global Streamer Week 2 Rankings Are Here!
📊 Rankings show the pros — cash rewards incoming!
Top streamers earned cash + featured exposure. Rewards arrive in 3 business days.
🚀 New week’s leaderboard is live — don’t miss out!
Go live 3 times to enter the rankings and win rewards + exposure!
🎯 Start streaming now and climb the leaderboard!
🔗 Go Live: https://www.gate.com/live?type=apply
🔗 Event Details: https://www.gate.com/announcements/article/50128
💥 Leaderboard updates constantly — your top spot could be next!