Bitcoin, Ethereum, and XRP continue to trade cautiously on Wednesday as upward momentum across the cryptocurrency market gradually weakens. The cautious capital flow prevents large-cap coins from breaking out of prolonged consolidation.
BTC remains range-bound within a familiar parallel channel, reflecting hesitation between bulls and bears. ETH continues to struggle near a key resistance zone, attempting multiple times to break through but without success. Meanwhile, XRP stays fragile within a downtrend channel, posing risks if buying pressure does not improve soon.
Overall, the top three digital assets in the market have yet to establish a clear trend, as sideways accumulation continues to dominate investor sentiment.
Bitcoin Continues to Fluctuate in a Narrow Range
Bitcoin’s price hovers around $68,300 on Wednesday, continuing to consolidate within a relatively wide parallel channel. The short-term trend remains slightly bullish as long as the price stays above the midpoint of this structure. The nearest resistance is identified around $71,980, while notable support is at $65,120.
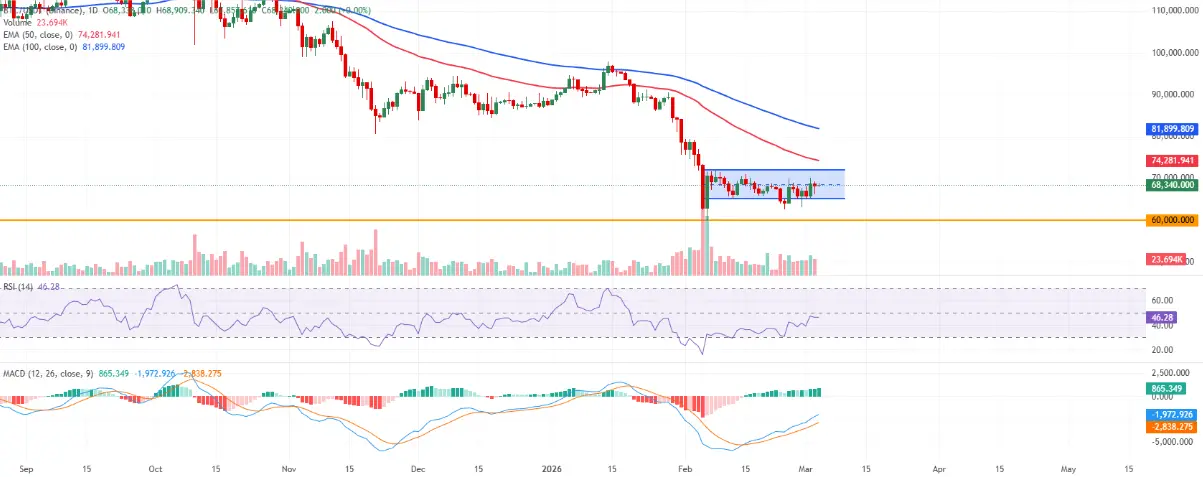 Daily BTC/USDT Chart | Source: TradingView “Crypto King” is still trading below the 50- and 100-day exponential moving averages (EMA), which are converging around $80,000 — a significant technical barrier in the medium term. However, the MACD indicator on the daily timeframe remains above the signal line and in positive territory, with the histogram expanding upward. This suggests that bullish momentum is gradually improving, though the medium-term trend still requires further confirmation.
The RSI stands at 46, indicating that selling pressure has eased after a rebound from oversold levels, reinforcing a balanced state rather than signaling a new wave of selling.
Technically, the resistance at $71,980 — the upper boundary of the channel — is a key hurdle. A daily close above this level could open the way toward the recent high near $75,770.
Ethereum Faces Rejection at Upper Boundary of Accumulation Zone
Ethereum is trading around $1,950 on Wednesday, but the short-term technical picture remains cautious. The price continues to move within a descending channel, with notable resistance near $2,148. Recent rebounds have made the market “more breathable,” but buying strength is still insufficient to challenge the upper boundary of the channel.
ETH remains below both the 50- and 100-day EMAs — both trending downward — indicating that the bearish trend still dominates. Momentum indicators show only temporary stability: the daily RSI has moved out of oversold territory and is rising toward 40, but remains well below the neutral 50 level. Meanwhile, MACD, although above the signal line, hovers near zero, implying selling pressure has weakened but not enough to confirm a clear reversal.
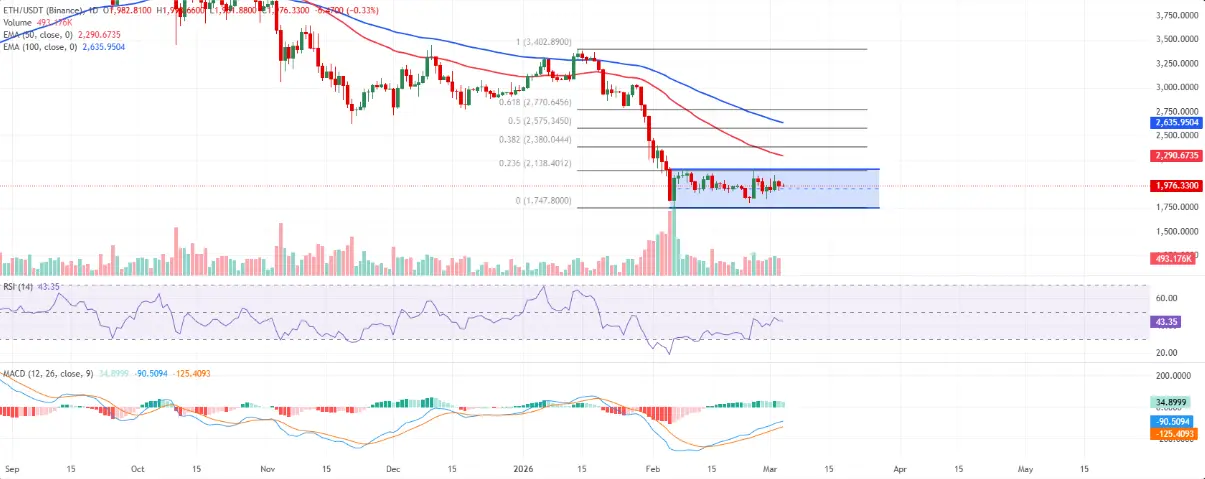 Daily ETH/USDT Chart | Source: TradingView Above, the zone between $2,138 and $2,148 — the confluence of the descending channel’s resistance and the 23.6% Fibonacci retracement (from $3,402 down to $1,747) — is a critical barrier. A daily close above this area could pave the way toward $2,380 — the 38.2% Fibonacci retracement level — where the 50-day EMA is likely to exert further pressure.
Conversely, the nearest support is at $1,856, with a deeper support around the channel’s bottom near $1,750, which also aligns with the Fibonacci retracement of the current correction. Losing the $1,750 level could extend the decline, while failure to break above $2,138 indicates bears still hold the short-term trend.
XRP Remains Trapped in a Downtrend Channel
XRP is trading around $1.36 at the time of writing, but the technical outlook remains cautious. The price continues to be confined within a downtrend channel starting from the over $2.80 high, keeping the short-term trend negative, although it has temporarily held above the lower boundary near $1.24.
Selling pressure persists as the price stays below the 50- and 100-day EMAs, currently converging around $1.55 — a significant resistance zone for any recovery attempts. The RSI is at 41, below neutral, reflecting a slight advantage for sellers despite previous oversold conditions easing. Meanwhile, MACD lines hover just above zero with a mildly positive histogram, indicating weak bullish momentum that is insufficient to reverse the main downtrend.
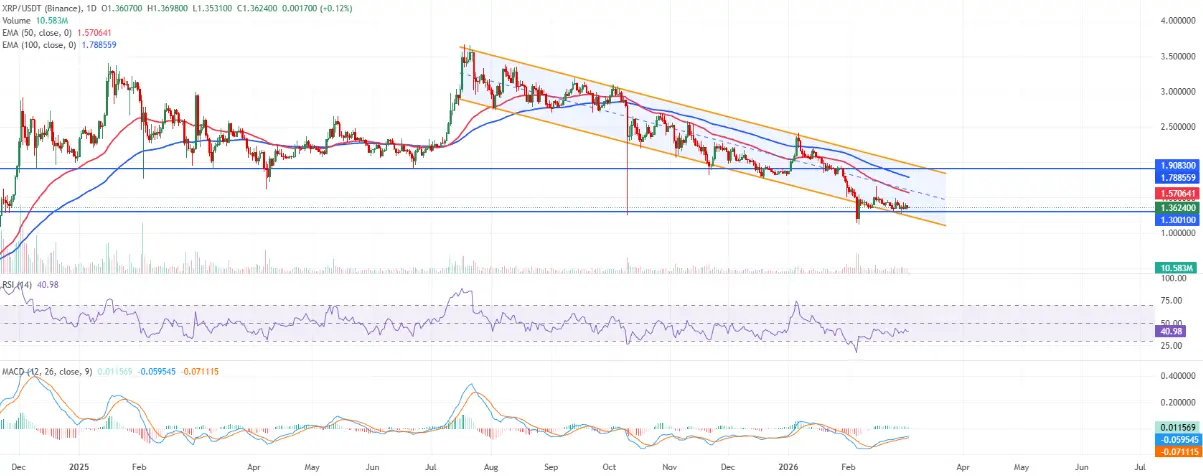 Daily XRP/USDT Chart | Source: TradingView Support levels include $1.30, the closest barrier — corresponding to the lower half of the channel. If this level is broken, the risk of retesting the channel’s bottom at $1.24 increases, potentially deepening the decline within the current negative structure.
On the upside, immediate resistance is at $1.58, where recent highs, the channel’s centerline, and the 50-day EMA converge. A stronger resistance zone lies at $1.91, aligning with previous horizontal resistance and near the 100-day EMA around $1.78. Only a decisive daily close above $1.91 would invalidate the downtrend, opening the door for a clearer and more sustained recovery.
Disclaimer: The information on this page may come from third parties and does not represent the views or opinions of Gate. The content displayed on this page is for reference only and does not constitute any financial, investment, or legal advice. Gate does not guarantee the accuracy or completeness of the information and shall not be liable for any losses arising from the use of this information. Virtual asset investments carry high risks and are subject to significant price volatility. You may lose all of your invested principal. Please fully understand the relevant risks and make prudent decisions based on your own financial situation and risk tolerance. For details, please refer to
Disclaimer.
Related Articles
Two whales opened short positions of one million BTC each, with liquidation prices above $69,580.
BlockBeats message, March 27, according to monitoring by Hyperinsight, within the past 20 minutes, the two addresses 0x4ef and 0xd04 opened high-leverage BTC short positions near $68,580 in succession. The position sizes both exceed $1 million. Currently, there is a slight unrealized loss of about 4%. Their liquidation prices are located at $69,582 and $69,947, respectively.
BlockBeatNews7m ago
Bitcoin macro risks spike as Ukraine throws a spanner in Trump's plan to stabilize oil markets
Ukraine's drone strikes have exacerbated oil market instability during the Iran war, complicating Trump's efforts to stabilize prices. This disruption risks prolonged high oil prices, leading to inflation and potential Fed rate hikes, which could challenge cryptocurrency stability.
CoinDesk21m ago
Bitcoin Drawdowns Deepen As Recovery Periods Extend Toward 300 Days
_Each 10% Bitcoin drawdown adds ~80 days, with the current recovery timeline estimated at nearly 300 days._
_Q1 2026 Bitcoin options expiry covers ~40% of open interest, with max pain anchored near $75,000._
_MARA sold 15,133 BTC at $65,300, posting a ~$236M loss while saving $88M via
LiveBTCNews23m ago
Ukraine's raid disrupts the oil market, Trump's plan is thwarted, and Bitcoin faces the risk of falling below $65,000.
Geopolitical conflicts are reshaping global financial markets, with the situations in Iran and Ukraine leading to rising energy prices, affecting the Federal Reserve's interest rate hike expectations and Bitcoin's value. Analysis indicates that rising energy costs will drive inflation, and the market is focused on Bitcoin's support levels.
GateNews32m ago
JPMorgan Says Bitcoin Shows Safe-Haven Demand During Iran War as Gold, Silver Weaken
Bitcoin has demonstrated greater resilience than traditional safe-haven assets during the Iran war, attracting net inflows and showing stronger liquidity conditions while gold and silver have faced sharp outflows and position unwinds, according to JPMorgan analysts led by managing director Nikolaos Panigirtzoglou.
CryptopulseElite37m ago
