Hyperliquid’s native token $HYPE recently attempted a rebound from lows, but Coinglass’s liquidation map shows approximately $28.9 million in short positions concentrated above the $35 level. Meanwhile, the MACD indicator experienced a bullish crossover on Sunday, signaling a potential technical trend reversal.
Liquidation Map Analysis: The $35 Key Breakout Point
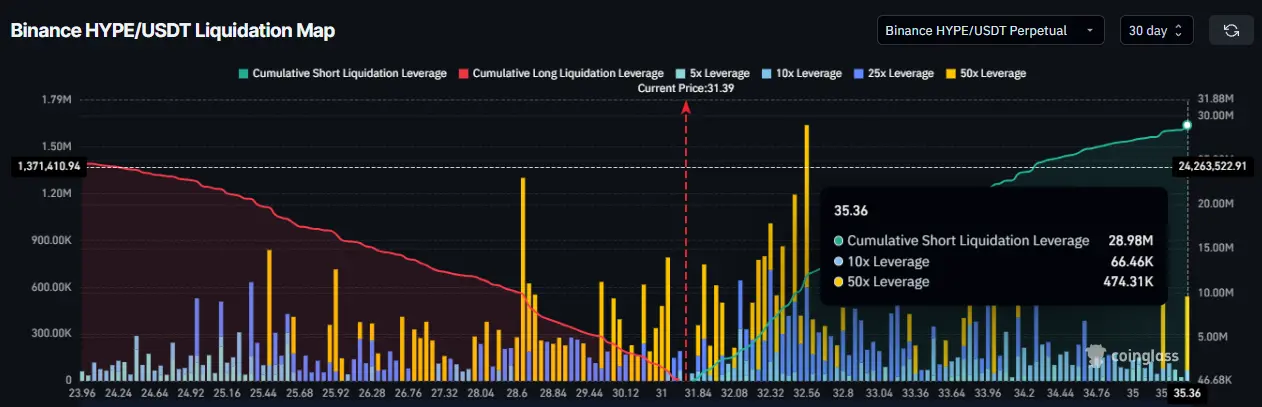
(Source: Coinglass)
Hyperliquid’s liquidation structure exhibits a clear directional asymmetry: currently, high-liquidity contracts are dominated by short positions, with over $28.9 million in shorts heavily concentrated around the $35 price level.
This concentration of shorts can be interpreted from two perspectives:
On one hand, the large number of short positions reflects market expectations that $HYPE will continue its downtrend, creating technical selling pressure. On the other hand, the dense cluster of shorts also sets the stage for a potential upward catalyst—if buying momentum drives $HYPE to decisively break through $35, forced short covering will trigger a chain reaction, amplifying the upward move. This “short squeeze” could push the price rapidly toward the $38 region, as technical analysis suggests.
At around $38, the distance between the 50-day and 200-day moving averages may narrow further. If, after short liquidation, these moving averages form a golden cross, it would serve as a stronger confirmation of a medium-term bullish structure.
Technical Signals and Key Price Levels
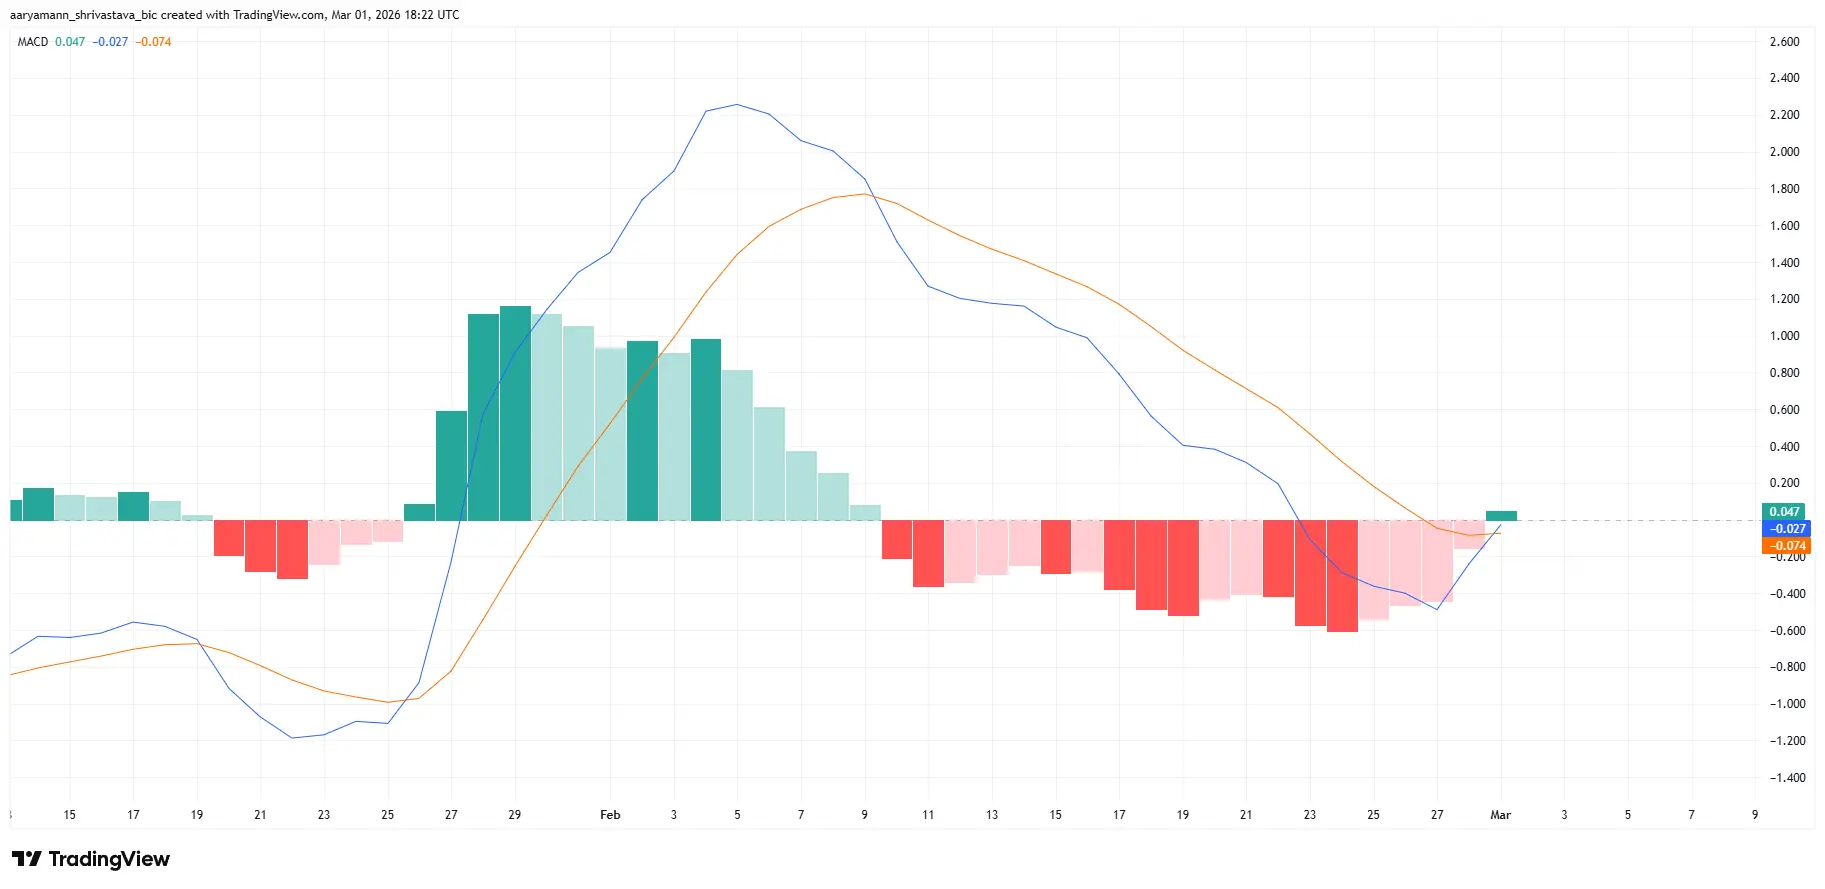
(Source: TradingView)
Beyond the liquidation structure, technical indicators provide initial positive signals for short-term momentum.
The MACD (Moving Average Convergence Divergence) experienced a bullish crossover on Sunday, with the DIF line crossing above the DEA line, a common short-term buy signal in technical analysis. The narrowing and turning positive of the histogram suggest that selling momentum may be weakening. If spot buying demand aligns with these technical signals, $HYPE could gradually establish a stable upward trend in the near term.
Key technical levels to watch are:
- First Resistance: $34 — immediate overhead pressure for spot price
- Core Liquidation Trigger: $35 — short position concentration zone; breaking through could trigger a chain reaction
- Short Squeeze Target: $38 — price target after $28.9 million short liquidation
- First Support: $30 — critical bottom line protecting the bullish structure
- Secondary Support: $26 — next major support if $30 fails
Frequently Asked Questions
Q: Why does the $HYPE short liquidation at $35 amplify the price movement?
In futures markets, traders holding short positions typically set stop-loss orders just above key resistance levels. When the price breaks above $35, many stop-loss orders are triggered automatically, forcing traders to buy back (cover) their shorts. This forced buying adds to the upward momentum, accelerating the price increase—creating a short squeeze. The $28.9 million concentrated liquidation can generate significant volatility in a short period.
Q: Is the MACD bullish crossover enough to confirm a trend reversal for $HYPE?
A MACD crossover is a short-term bullish signal indicating increasing buying momentum, but it alone is insufficient to confirm a trend reversal. Analysts usually recommend combining it with volume analysis, spot market strength, and other momentum indicators like RSI. Given the current macro environment—geopolitical tensions and overall market risk appetite—this initial technical signal needs macro confirmation to be reliable.
Q: If $HYPE falls below $30 support, what signals should investors watch?
$30 is the current structural support that has maintained the upward trend for over a month and a half. A breakdown below this level would shift the focus to the next support at $26, and the bullish structure would be invalidated. Investors should monitor whether volume increases during the decline (confirming genuine selling pressure) and whether spot funds are flowing out (net outflows), which would indicate the breakdown’s sustainability.
Disclaimer: The information on this page may come from third parties and does not represent the views or opinions of Gate. The content displayed on this page is for reference only and does not constitute any financial, investment, or legal advice. Gate does not guarantee the accuracy or completeness of the information and shall not be liable for any losses arising from the use of this information. Virtual asset investments carry high risks and are subject to significant price volatility. You may lose all of your invested principal. Please fully understand the relevant risks and make prudent decisions based on your own financial situation and risk tolerance. For details, please refer to
Disclaimer.
Related Articles
Ethereum Outperforms S&P 500 by 1,696 Basis Points Since U.S.-Iran Conflict, Says Tom Lee
Gate News message, April 27 — Tom Lee, chairman of Bitmine, stated that Ethereum has outperformed the S&P 500 index (U.S. benchmark equity index) by 1,696 basis points since the U.S.-Iran conflict, making it the best-performing single asset globally aside from crude oil. According to Lee, ETH has de
GateNews1h ago
New Altcoins Outperform Older Tokens in 2025, Data Shows Divergence in Exchange Performance
Gate News message, April 27 — In 2025, newly launched altcoins significantly outperformed older tokens, marking a shift in how liquidity is allocated across the crypto market. While older altcoins posted net losses between 18% and 23%, newly listed altcoins in 2025 retained 5% in net gains,
GateNews1h ago
SHIB Exchange Inflows Ease as 43B Tokens Hit Platforms
Shiba Inu recorded a softer inflow trend to exchanges after approximately 43 billion SHIB moved to trading platforms in 24 hours, according to on-chain data. The figure remains positive but shows a slower pace compared with earlier spikes, suggesting that short-term selling pressure may be
CryptoFrontier3h ago
NFT Blue Chips Rally as Prices Climb Despite Thinning Market Activity
With 201 sales and approximately 1,000 ETH in volume over the previous seven days, Pudgy Penguins has seen a floor rise above 5 ETH, a 20% increase from last week.
Data from CryptoSlam shows that worldwide sales of NFTs declined to around $175 million in April from $304 million in
TheNewsCrypto3h ago
Bullish Altseason Indicators Continue to Appear as Expectations for New Altcoin ATHs Rise
Bullish altseason indicators continue to appear.
Expectations for new altcoin ATHs to occur rise.
Which altcoin assets will set a new ATH first?
The crypto market continues to hold steady prices as promising crypto assets show high possibilities for their prices to hit higher bullish ta
CryptoNewsLand4h ago
Global Crypto Funds Record $1.2B Weekly Inflows as Bitcoin Leads Institutional Capital Surge
Gate News message, April 27 — Global crypto investment products issued by asset managers including BlackRock, ARK 21Shares, and Fidelity recorded $1.2 billion in net inflows last week, according to CoinShares data. Bitcoin-based products led the charge with $932.5 million, pushing year-to-date bitco
GateNews5h ago