
Market technician Patrick Karim shared a striking long-term chart this week with a simple message:
“Crude Oil. Whatever happens on the Monday open is irrelevant on the longer-term roadmaps. The pathway for higher prices for crude oil has been laid out by silver & gold.”
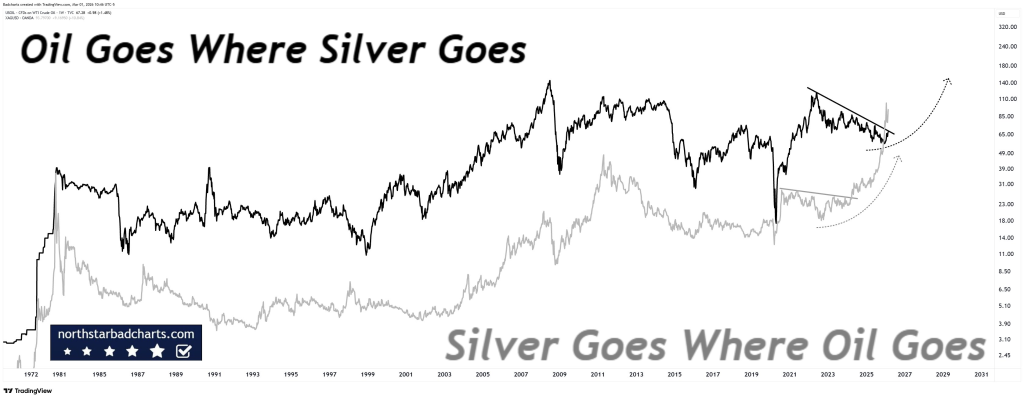
The chart compares decades of price action between crude oil and silver. One line tracks oil. The other tracks silver. The message is visual and blunt: major structural moves in silver tend to precede or align with large directional changes in oil.
This is about multi-year structure.
What the Long-Term Chart Is Showing
The chart stretches back to the 1970s. Across multiple cycles (inflation spikes, recessions, commodity booms, and crashes) oil and silver move in broad alignment during major macro phases.
When precious metals enter structural uptrends, oil often follows.
Right now, silver has already broken into a powerful bull phase. After consolidating for years, it exploded higher, printed new highs, corrected sharply, and is now rebuilding structure near key resistance. The longer-term pattern shows higher highs and higher lows across the macro timeframe.
Oil, by contrast, has been compressing.
Source: X/@badcharts1
On Karim’s chart, crude appears to be forming a large multi-year consolidation with a descending trendline capping recent rallies. Price has pulled back from prior highs but has not broken down structurally. It looks coiled.
There’s also a curved projection sketched on the right side of the chart. That projection mirrors silver’s prior breakout path and implies that oil could follow a similar expansion phase once resistance gives way.
The implication is clear: metals have already signaled the inflationary pressure. Oil may simply be lagging.
Read also: ChatGPT Predicts the Price of Silver and Gold If the U.S.–Iran War Escalates Further
Why Silver and Gold Could Be Leading
Precious metals tend to respond first to monetary instability, currency debasement fears, and geopolitical stress. They move when capital seeks protection.
Energy often reacts later, when inflation pressure feeds directly into supply chains and real-economy pricing.
Silver’s breakout above long-standing resistance indicates that liquidity conditions and inflation expectations are shifting. Gold has also remained structurally strong despite volatility in equities and crypto.
If metals are in the early phase of a broader commodity cycle, oil would not stay suppressed for long.
Karim’s point about the Monday open being irrelevant speaks to this idea. Short-term gaps driven by headlines do not change multi-year trend structure. Weekly and monthly charts define the real roadmap.
As long as crude oil holds its long-term support zones and continues compressing beneath that descending resistance, the setup resembles a classic coil before expansion.
A decisive breakout above that multi-year trendline would likely trigger momentum flows and repositioning across commodity markets.
If silver continues higher, Karim’s thesis indicates oil will not remain behind for long.
Read also: Strait of Hormuz Freeze: Oil Tankers Turn Back as War Risk Insurance Vanishes Overnight
Disclaimer: The information on this page may come from third parties and does not represent the views or opinions of Gate. The content displayed on this page is for reference only and does not constitute any financial, investment, or legal advice. Gate does not guarantee the accuracy or completeness of the information and shall not be liable for any losses arising from the use of this information. Virtual asset investments carry high risks and are subject to significant price volatility. You may lose all of your invested principal. Please fully understand the relevant risks and make prudent decisions based on your own financial situation and risk tolerance. For details, please refer to
Disclaimer.
Related Articles
ETH 15-minute drop of 0.66%: short-term holders selling off in tandem with exchange net inflows amplifies the selling pressure
2026-04-12 22:00 to 22:15 (UTC), ETH showed a clear downward move in a highly liquid environment. The candlestick chart indicates a return of -0.66%, with price fluctuations ranging from 2186.76 to 2211.25 USDT, and a swing amplitude of 1.11%. Market attention rose rapidly, short-term sentiment turned cautious, and volatility intensified.
The main driving factors behind this unusual move are a sharp increase in exchange net inflows and concentrated selling by short-term holders. On-chain data shows that over the past 24 hours, net inflow of ETH into exchanges totaled 9,567.65 ETH, suggesting that a large amount of capital entered the market in the short term, potentially increasing selling pressure.
GateNews1h ago
CTSI Price Soars 17.57%: Institutional Interest Ramps Up
Amid a crypto market downturn, CTSI surged 17.57% to $0.03626 in an hour, driven by high trading volume and institutional interest in altcoins. Traders are now watching key support and resistance levels for future price movements.
Coinfomania2h ago
Bitcoin falls below 71,500 USD, U.S.-Iran talks remain deadlocked, and the Strait of Hormuz becomes the biggest point of contention
On April 11, the U.S. and Iran began 20 hours of negotiations in Pakistan. The core issue was freedom of passage through the Strait of Hormuz. After Bitcoin briefly rose to $73,800, it quickly fell back to $71,557. The U.S. side took a hardline stance, demanding that Iran open the strait, while Iran insisted that easing restrictions must wait until a comprehensive agreement is reached. The two sides have not yet reached a consensus.
動區BlockTempo7h ago
Crypto Market Maintains Steady Growth Trajectory As Top Assets Show Gains
The crypto market continues to grow, with a market cap of $2.44T and Bitcoin and Ethereum showing slight increases. Top gainers include $GPM and $BASE. Meanwhile, DeFi TVL declined, NFT sales rose, and notable developments include a trader's significant loss and a push for regulatory clarity in Congress.
BlockChainReporter8h ago
BTC 15-minute chart slightly down 0.57%: leveraged long positions passively cut risk and macro sentiment disturbances drive volatility
2026-04-12 12:45 to 13:00 (UTC), the BTC price range was 71081.7 to 71493.2 USDT, with an amplitude of 0.58%. Within 15 minutes, the return recorded was -0.57%. During the period of unusual activity, market volatility increased somewhat, risk sentiment warmed up, and overall attention rose; however, there was no extreme surge in volume or a sudden drop in liquidity.
The main driver behind this unusual activity is that, under the leverage structure, long positions were reduced passively. Recently, the funding rate for perpetual contracts turned from negative to positive. Leverage among longs in the market accumulated; the price dipped slightly, triggering liquidations of some leveraged long positions and sell orders for position closures, resulting in
GateNews10h ago
Analyst: Bitcoin’s current pullback is relatively mild compared with past ones, but the bottom has not been confirmed yet.
Crypto analyst Axel Adler Jr said the current Bitcoin pullback is smaller than historic bearish-market levels, but a bottom has not yet been confirmed. He believes the market is still in a mild bear phase, and that a true recovery will require patience and waiting.
GateNews11h ago
