
There are various ways to make a lot of money from cryptos. Everything comes down to getting into the right opportunity at the right time. A top analyst recently shared a detailed breakdown of Arbitrum and why ARB price could create millionaires for those who understand the structure and act with patience.
Crypto Patel laid out his case clearly. He pointed to the brutal reality first. ARB has dropped about 96% from its 2024 all time high of $2.42. That type of drawdown often discourages most market participants. Crypto Patel believes this is exactly where rare opportunities are found.
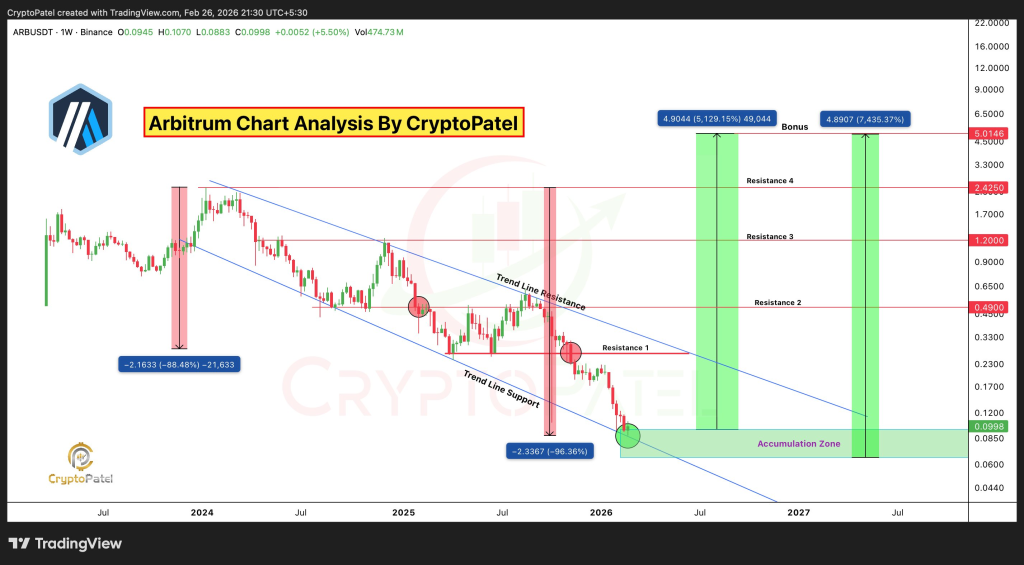
The chart shows ARB price moving inside a long descending channel that has been intact for almost 2 years. Each rally has been capped by a falling trendline. Each breakdown pushed price closer to the lower boundary of the channel.
Right now, ARB price is sitting at the bottom of that structure around the $0.09 to $0.06 zone. Crypto Patel describes this region as a high time frame demand block. Historical wick support appears in this area. The chart highlights heavy drawdowns of more than 88% and 96% during the decline.
That compression near the base of the channel matters. Volume absorption appears to be taking place. The candles show sideways action after the steep impulse drop. Crypto Patel frames this as a Wyckoff Phase C or early Phase D candidate. Seller exhaustion and demand absorption are key ideas in that model.
@CryptoPatel / X
Key Levels That Could Confirm A Bullish Arbitrum Trend Reversal
Crypto Patel does not claim the trend has flipped yet. He outlines clear confirmation levels. The first structural level sits at $0.23. A sustained move above that zone would mark a break of structure on the lower time frames.
The next major pivot stands at $0.49. That level aligns with the descending trendline resistance and the second resistance zone on the chart. A clean reclaim of $0.49 would signal a broader regime change.
Beyond that, upside targets expand toward $1.20, $2.42, and eventually $5 if the full structure flips bullish. The chart even maps a possible cycle expansion between 5,129% and 7,435% from the current base. Those projections depend entirely on structure holding above $0.06. A breakdown below $0.06 would invalidate the accumulation thesis.
Silver Price Manipulation? $1.6B Jane Street Position Raises Red Flags_**
Crypto Patel describes ARB as a high beta Layer 2 leader trading at a maximum confluence demand zone. Channel support, high time frame demand, Wyckoff accumulation, and seller exhaustion align in the same region. That cluster of signals forms the core of his thesis.
He emphasizes that this is a patience zone. Momentum traders often prefer chasing strength near resistance. Crypto Patel argues that asymmetric risk reward tends to appear when charts look the worst.
Disclaimer: The information on this page may come from third parties and does not represent the views or opinions of Gate. The content displayed on this page is for reference only and does not constitute any financial, investment, or legal advice. Gate does not guarantee the accuracy or completeness of the information and shall not be liable for any losses arising from the use of this information. Virtual asset investments carry high risks and are subject to significant price volatility. You may lose all of your invested principal. Please fully understand the relevant risks and make prudent decisions based on your own financial situation and risk tolerance. For details, please refer to
Disclaimer.
Related Articles
Bitcoin may have already bottomed out near $60,000. Here’s why.
Some worry bitcoin BTC$70,639.39 could still see a deeper sell-off, but one key indicator suggests the bottom may already be behind us.
That indicator is the 30-day implied volatility, which is an options-based measure of expected price turbulence over four weeks.
The widely-tracked 30-day implie
CoinDesk9m ago
Expert Highlights Two Crucial Signals on ETH Price Chart, Stoch RSI and Head and Shoulders
Expert highlights two crucial signals on ETH price chart.
One is the bearish Stoch RSI indicator that could push ETH below $2,000.
The other is a bullish Head and Shoulder pattern that could propel ETH price over $2,000.
The
CryptoNewsLand24m ago
Grayscale: AI and Financial Applications Perform Excellently Amid Q1 Geopolitical Turmoil
# Source: Grayscale Research; Compiled by: Jinse Finance
## Key Points:
-----
**2026 Q1 characterized by volatility:** Geopolitical risks and macroeconomic re-pricing drove sharp market swings.
**Industry-wide decline:** Returns across six major crypto sectors were negative for the second consecutive quarter, as risk-off sentiment and deleveraging accelerated.
**Financial applications and tokenization projects lead:** Supported by institutional adoption and improved regulatory clarity, these projects outperformed the broader market.
**AI-related tokens stand out:** With increasing focus on artificial intelligence and clear on-chain financial settlement needs from agents, the AI sector emerged strongly.
## Overall Performance
The first quarter of 2026 was another challenging period for the crypto market.
金色财经_38m ago
# Gold and BTC Diverge: A Battle Over the Definition of Safe-Haven Assets
# Woke up, and BTC pulled back to 70k. On the drive this morning, the radio was reporting that gold came under pressure as the Fed's March FOMC meeting failed to meet rate cut expectations, erasing all gains for the year so far.
Recently, geopolitical tensions in the Middle East have escalated, causing global capital markets to shake. According to classical narratives in traditional finance, geopolitical conflicts should push up gold prices—a logic rooted in gold's thousands of years of safe-haven attributes, long since becoming the instinctive reaction of market participants. Yet the market performance in March 2026 has shattered this stereotype: gold prices continued to decline, breaking through the critical support level of $4,500, while Bitcoin's decline was far smaller than traditional risk assets like stocks, displaying a certain characteristic of "relative safe-haven."
This anomalous divergence, on the surface is a difference in asset price movements, but at a deeper level reflects a structural change long overlooked by the market: the investor base for gold and Bitcoin is undergoing a fundamental shift
金色财经_47m ago
Wall Street broker Bernstein calls bitcoin bottom, keeps $150,000 year-end target
Wall Street broker Bernstein sees Bitcoin likely at its bottom, targeting $150,000 by year-end. Analyst Gautam Chhugani cites strong demand and institutional interest, while emphasizing resilient assets like Strategy (MSTR) as a Bitcoin proxy amidst market volatility.
CoinDesk58m ago
Bernstein: Bitcoin May Have Hit Cyclical Bottom, Maintains $150,000 Target Price by End of 2026
Gate News reports that on March 24, according to CoinDesk, Wall Street brokerage Bernstein stated in its latest report that Bitcoin may have already reached a cyclical bottom, while maintaining a price target of $150,000 by the end of 2026. The report notes that previous pullbacks were mainly driven by high interest rate environments, Middle East geopolitical risks, and ETF outflows during a certain period, but the overall fundamentals have not experienced systemic pressure. Additionally, sustained ETF inflows and corporate treasury accumulation continue to be viewed as important factors driving Bitcoin's upside.
GateNews1h ago
