 Trusted Editorial content, reviewed by leading industry experts and seasoned editors. Ad Disclosure
Bitcoin has remained under sustained pressure since losing the $70,000 level, entering a corrective phase that has gradually pushed price lower while defining a consolidation range just above the $63,000 zone. Momentum has weakened noticeably, with buyers struggling to regain control and volatility compressing as the market searches for direction. This range-bound behavior reflects a transitional phase rather than a confirmed trend reversal, as traders weigh macro uncertainty, liquidity conditions, and broader risk sentiment across digital assets.
Trusted Editorial content, reviewed by leading industry experts and seasoned editors. Ad Disclosure
Bitcoin has remained under sustained pressure since losing the $70,000 level, entering a corrective phase that has gradually pushed price lower while defining a consolidation range just above the $63,000 zone. Momentum has weakened noticeably, with buyers struggling to regain control and volatility compressing as the market searches for direction. This range-bound behavior reflects a transitional phase rather than a confirmed trend reversal, as traders weigh macro uncertainty, liquidity conditions, and broader risk sentiment across digital assets.
Related Reading: Every Ethereum Whale Cohort Now Underwater: ETH Capitulation Marking The Final Bottom?Amid this backdrop, Bitcoin mining difficulty has recently rebounded following a brief dip. Mining difficulty adjusts roughly every two weeks to maintain consistent block production timing. When difficulty rises, it typically signals that more computational power — or hashrate — has returned to the network. Temporary drops can occur when external factors, such as weather disruptions, energy constraints, or operational shutdowns, force some miners offline.
The recent rebound, therefore, suggests renewed miner participation and sustained network resilience. Greater difficulty often indicates confidence among miners in Bitcoin’s long-term viability, as maintaining operations becomes more competitive and capital-intensive. However, it can also increase cost pressure on less efficient miners, potentially influencing short-term supply dynamics if some are forced to liquidate holdings to cover expenses.
Mining Difficulty Rebound Signals Network Resilience
The recent dip in mining difficulty was largely weather-driven rather than structurally bearish. Severe winter storms temporarily disrupted energy supply in key mining regions, forcing portions of the network’s hashrate offline. As a result, the previous difficulty adjustment registered a short-lived decline, reflecting reduced computational power securing the network at that moment.
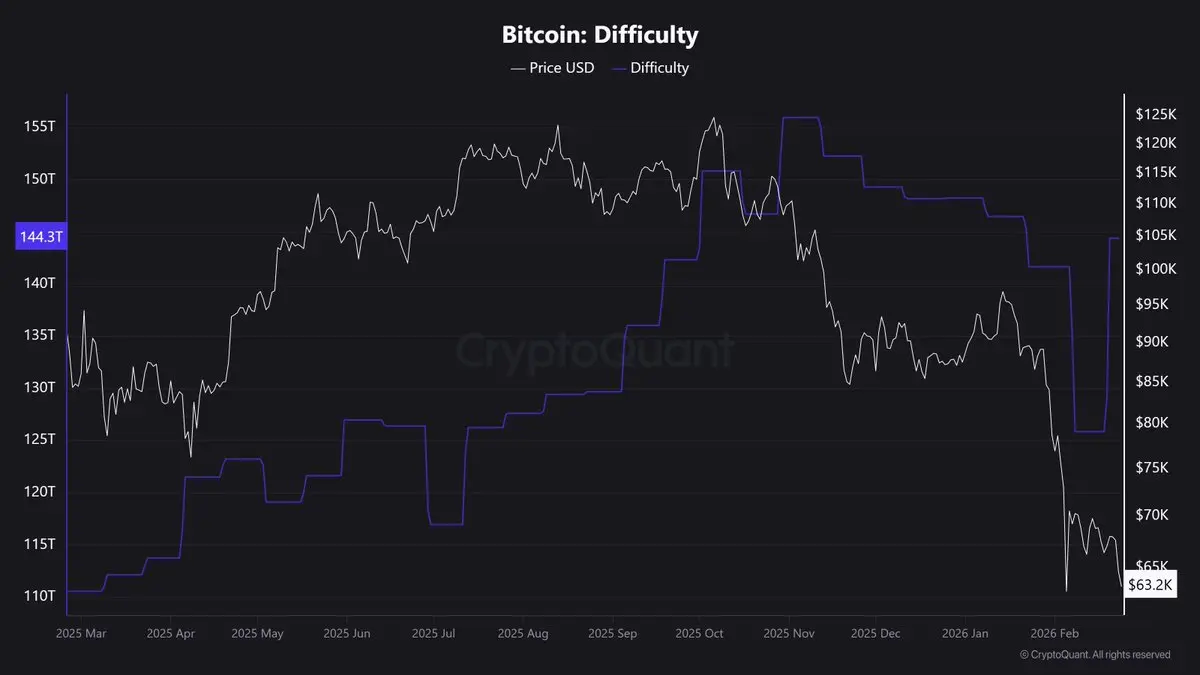 Bitcoin Difficulty | Source: CryptoQuant
However, the disruption proved brief. According to on-chain data, the latest adjustment reversed the drop and pushed difficulty back to new highs, confirming that miners rapidly restored operations. Network hashrate has rebounded toward its prior range, signaling that the infrastructure impact was temporary rather than systemic. Block production times, which had briefly slowed, normalized quickly as computational power returned.
Bitcoin Difficulty | Source: CryptoQuant
However, the disruption proved brief. According to on-chain data, the latest adjustment reversed the drop and pushed difficulty back to new highs, confirming that miners rapidly restored operations. Network hashrate has rebounded toward its prior range, signaling that the infrastructure impact was temporary rather than systemic. Block production times, which had briefly slowed, normalized quickly as computational power returned.
This rebound carries structural implications. Mining difficulty rising after a shock indicates that capital remains committed to the network despite price weakness below $70,000. It also suggests that the broader mining ecosystem retains operational resilience, even under adverse conditions.
At the same time, greater difficulty increases production costs, particularly for less efficient operators. If Bitcoin’s price remains compressed near the $63,000–$65,000 range, margin pressure could intensify for high-cost miners. Nonetheless, the swift recovery in difficulty reinforces the view that network fundamentals remain intact despite short-term volatility.
Related Reading: Bitcoin’s Decay Signals the Most Severe Bearish Pivot Since the LUNA Collapse – A 2022 Echo
Bitcoin Tests Key Support As Downtrend Pressure Persists
Bitcoin’s weekly chart shows a clear deterioration in momentum after losing the $70,000 level, with price now consolidating near the $63,000 zone. The structure reflects a sequence of lower highs since the late-2025 peak above $120,000, indicating that sellers remain dominant despite intermittent stabilization attempts.
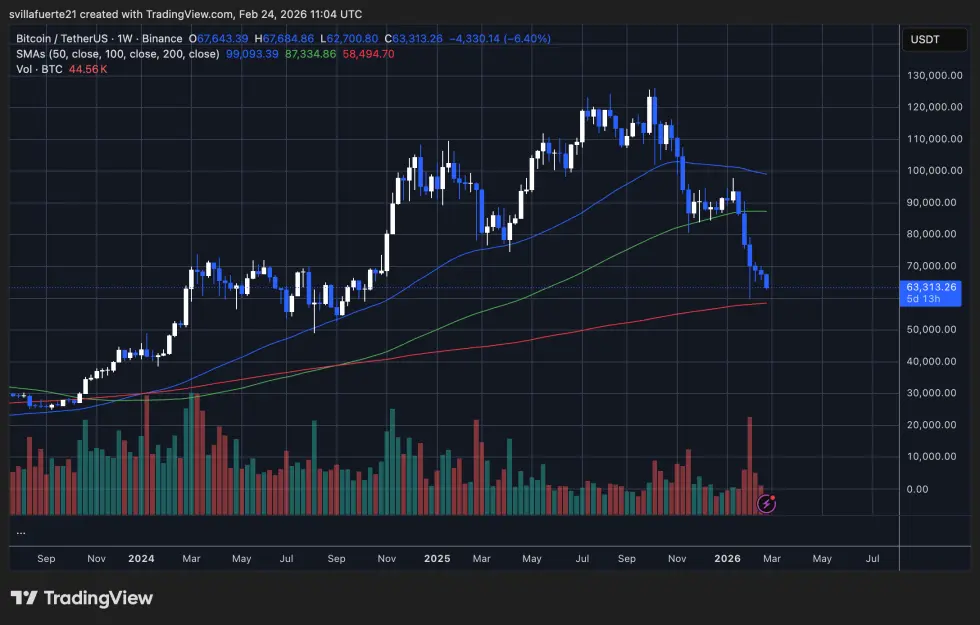 Bitcoin testing key demand | Source: BTCUSDT chart on TradingView
Technically, Bitcoin is trading below the 50-week and 100-week moving averages, both of which have shifted from support into dynamic resistance. This configuration typically signals a transitional or corrective phase rather than a confirmed bullish continuation. Meanwhile, the 200-week moving average — currently much lower — remains the long-term structural support reference.
Bitcoin testing key demand | Source: BTCUSDT chart on TradingView
Technically, Bitcoin is trading below the 50-week and 100-week moving averages, both of which have shifted from support into dynamic resistance. This configuration typically signals a transitional or corrective phase rather than a confirmed bullish continuation. Meanwhile, the 200-week moving average — currently much lower — remains the long-term structural support reference.
Related Reading: Every Ethereum Whale Cohort Now Underwater: ETH Capitulation Marking The Final Bottom?
Volume patterns also suggest caution. Selling activity increased during the latest decline, pointing to distribution rather than simple low-liquidity drift. However, recent candles show some compression in volatility, implying that the market may be attempting to establish a short-term base around current levels.
From a structural perspective, the $60,000–$63,000 region now acts as immediate support. A sustained break below it could expose deeper retracement zones toward the mid-$50,000 area. Conversely, reclaiming the $70,000 threshold would be necessary to restore bullish momentum and shift sentiment toward recovery.
Featured image from ChatGPT, chart from TradingView.com
![]() Editorial Process for bitcoinist is centered on delivering thoroughly researched, accurate, and unbiased content. We uphold strict sourcing standards, and each page undergoes diligent review by our team of top technology experts and seasoned editors. This process ensures the integrity, relevance, and value of our content for our readers.
Editorial Process for bitcoinist is centered on delivering thoroughly researched, accurate, and unbiased content. We uphold strict sourcing standards, and each page undergoes diligent review by our team of top technology experts and seasoned editors. This process ensures the integrity, relevance, and value of our content for our readers.
Disclaimer: The information on this page may come from third parties and does not represent the views or opinions of Gate. The content displayed on this page is for reference only and does not constitute any financial, investment, or legal advice. Gate does not guarantee the accuracy or completeness of the information and shall not be liable for any losses arising from the use of this information. Virtual asset investments carry high risks and are subject to significant price volatility. You may lose all of your invested principal. Please fully understand the relevant risks and make prudent decisions based on your own financial situation and risk tolerance. For details, please refer to
Disclaimer.
