 The post Bitcoin (BTC) Price Recovers Above $66,000—Is the Crypto Market at a Breaking Point? appeared first on Coinpedia Fintech News
Since the October 10, 2025, liquidation event, the crypto market feels noticeably different. Bitcoin’s recent drops are no longer followed by strong relief rallies, which suggests buyers are hesitant to step in aggressively. Adding to the tension, Polymarket is now pricing in a 72% chance of Bitcoin price falling below $55,000 — a clear sign that downside fears are growing.
Recent Bitcoin buyers are already sitting on roughly $26 billion in unrealized losses. If BTC slides toward $60,000 or even lower, those losses could swell to nearly $32 billion
![]() That kind of pressure can easily trigger panic, forcing weaker hands out before a rebound takes shape. The big question is whether this pain is the final shakeout or a warning of deeper trouble ahead.
That kind of pressure can easily trigger panic, forcing weaker hands out before a rebound takes shape. The big question is whether this pain is the final shakeout or a warning of deeper trouble ahead.
Short-Term Bitcoin Holders Are Feeling the Heat
This Glassnode chart shows how short-term Bitcoin holders (recent buyers) are performing in terms of realized profit or loss, adjusted for market activity. The green spikes signal moments when these traders are locking in profits—typically during strong rallies. Red zones, on the other hand, highlight periods where recent buyers are selling at a loss, often during pullbacks or sharp corrections.
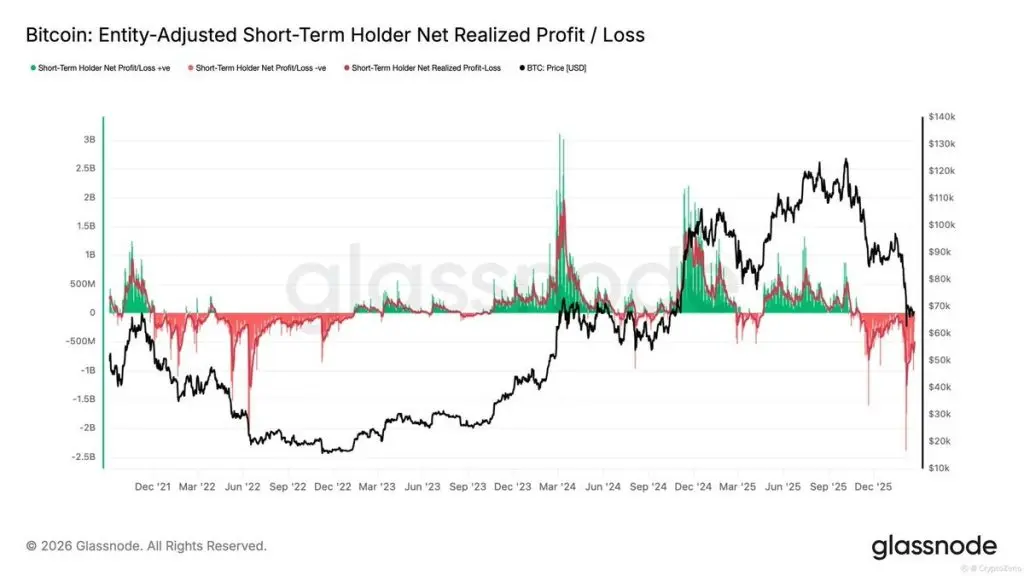 What stands out is the current deep red phase. It suggests many short-term holders are under pressure and sitting on losses as the price retraces. Historically, such conditions reflect fear and weak hands exiting the market. While painful in the short run, these phases often coincide with local bottoms or late-stage corrections, where selling pressure starts to exhaust, and the market quietly prepares for a potential stabilisation or rebound.
Bitcoin Struggles Below Key Resistance as Bears Defend the Trend
This 4-hour BTC chart shows Bitcoin trading below a well-defined descending trend line, which has repeatedly capped upside attempts. Price is currently hovering around the 0.382 Fibonacci zone at $67,300, highlighting short-term indecision. Notably, RSI has rebounded from the lower threshold, signaling short-term selling exhaustion and hinting at a relief bounce. However, since this is a short-term setup, its impact on the broader, long-term trend remains limited.
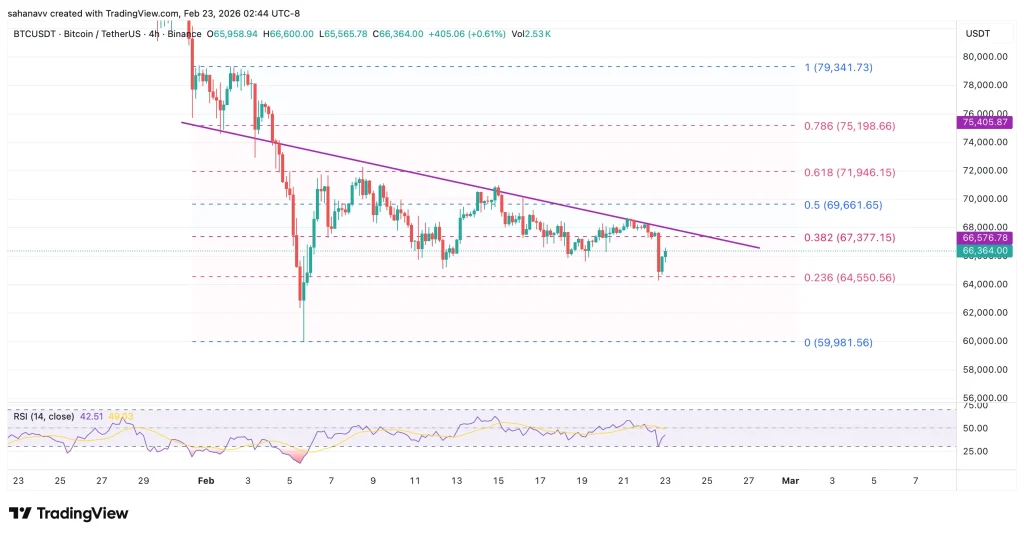 On the bullish side, a reversal would only be validated if Bitcoin decisively breaks and closes above the descending trend line. A sustained move above the 0.5 Fibonacci level (~$69,600) could attract fresh buying pressure, potentially pushing the price toward $72,000, with an extended upside toward $75,000 if momentum follows. On the bearish side, rejection below the trend line keeps the structure weak. A drop below $64,500 (0.236 Fib) may expose BTC to deeper downside toward the $60,000 demand zone.
Wrapping it Up
Bitcoin is showing early signs of short-term stabilization, supported by a rebound in momentum, but the broader structure remains cautious. As long as the BTC price trades below the descending trend line, upside moves are likely to be corrective rather than trend-changing. A confirmed breakout and acceptance above the 0.5 Fibonacci level would be needed to shift sentiment and invite stronger buying interest toward higher levels
Until that happens, the market stays range-to-weak, with traders watching closely for either a breakout confirmation or another rejection-driven move lower.
Disclaimer: The information on this page may come from third parties and does not represent the views or opinions of Gate. The content displayed on this page is for reference only and does not constitute any financial, investment, or legal advice. Gate does not guarantee the accuracy or completeness of the information and shall not be liable for any losses arising from the use of this information. Virtual asset investments carry high risks and are subject to significant price volatility. You may lose all of your invested principal. Please fully understand the relevant risks and make prudent decisions based on your own financial situation and risk tolerance. For details, please refer to
Disclaimer.
Related Articles
Michael Saylor Warns Quantum Threat Would Break the Internet - U.Today
Michael Saylor argues that quantum computing poses a universal risk beyond Bitcoin, threatening critical global infrastructure. In response to Chamath Palihapitiya's views on AI and market disruptions, Saylor insists that a transition to Post-Quantum Cryptography will protect Bitcoin and other systems together, emphasizing its resilience as "Digital Capital."
UToday1m ago
Man Alleges Wife Stole $172 Million in Bitcoin After 'Covertly Recording' Him
In brief
A now-estranged wife is alleged to have stolen $172 million in Bitcoin from her husband.
A court filing alleges that she used CCTV footage to obtain the seed phrase for a hardware wallet containing the Bitcoin.
After being warned of the potential theft, the husband set up
Decrypt2m ago
IBM Opens Quantum Hardware to Researchers as Bitcoin Security Threat Looms
In brief
IBM expanded its free quantum computing program, increasing runtime and hardware access for researchers.
The company opened its Heron R2 processor to users who were previously limited to entry-level systems.
Advances in quantum research are pushing Bitcoin developers to prepare f
Decrypt37m ago
Analyst Says Bitcoin Indicators Show Early Signs of Market Recovery
Stablecoin liquidity rose by ~$8B since February, signaling potential improved market trading conditions.
Inter-exchange Flow Pulse turned positive, indicating more Bitcoin moving to derivatives platforms.
Long-term holders retain ~79% of supply, showing gradual supply transfers
CryptoFrontNews1h ago
Bitcoin Surges Above $74K After Rally From $60K Support Level
Bitcoin surged from $60K to nearly $74K, gaining 23% as buyers maintained momentum, indicated by a positive RSI and MACD. Key resistance lies at $74K, with support levels at $72.8K, $71.5K, and $70K. Traders anticipate potential further gains.
CryptoFrontNews1h ago
Michael Saylor’s Strategy Adds $1.57B in Bitcoin, Treasury Swells to 761K BTC
Strategy announced on Monday that it bought another large tranche of Bitcoin, adding 22,337 BTC, a purchase the company says cost roughly $1.57 billion at an average of about $70,194 per coin, pushing its total holdings to 761,068 BTC. The disclosure, filed as a Form 8-K and shared in a company
BlockChainReporter1h ago
