The cryptocurrency market begins the new week in an atmosphere of tension, as a wave of panic spreads and widespread selling pressure dominates. A series of altcoins such as Zcash (ZEC), Pump.fun (PUMP), and LayerZero (ZRO) all weaken simultaneously. Bitcoin is also not immune to the negative trend, plunging below the $65,000 mark amid U.S. President Donald Trump regrouping forces, raising new risks related to trade policies. Technically, ZEC, PUMP, and ZRO are signaling unfavorable prospects, as bearish momentum increases and the risk of sharp declines remains present.
Zcash Extends Correction After a Negative Week
Zcash is trading below the $250 level, recording approximately a 5% decline at the time of writing on Monday. This weakening follows an 18% drop last week, bringing the total decline to nearly 30%. However, the 38.2% Fibonacci retracement zone around $231 — measured from the August 20 low at $34.45 to the November 7 high at $750 on the daily logarithmic chart — still acts as a short-term support buffer for the price.
If the price closes decisively below $231, selling pressure is likely to increase, pushing Zcash back toward the next support zone around $187 — a level that previously triggered a significant rebound on February 6.
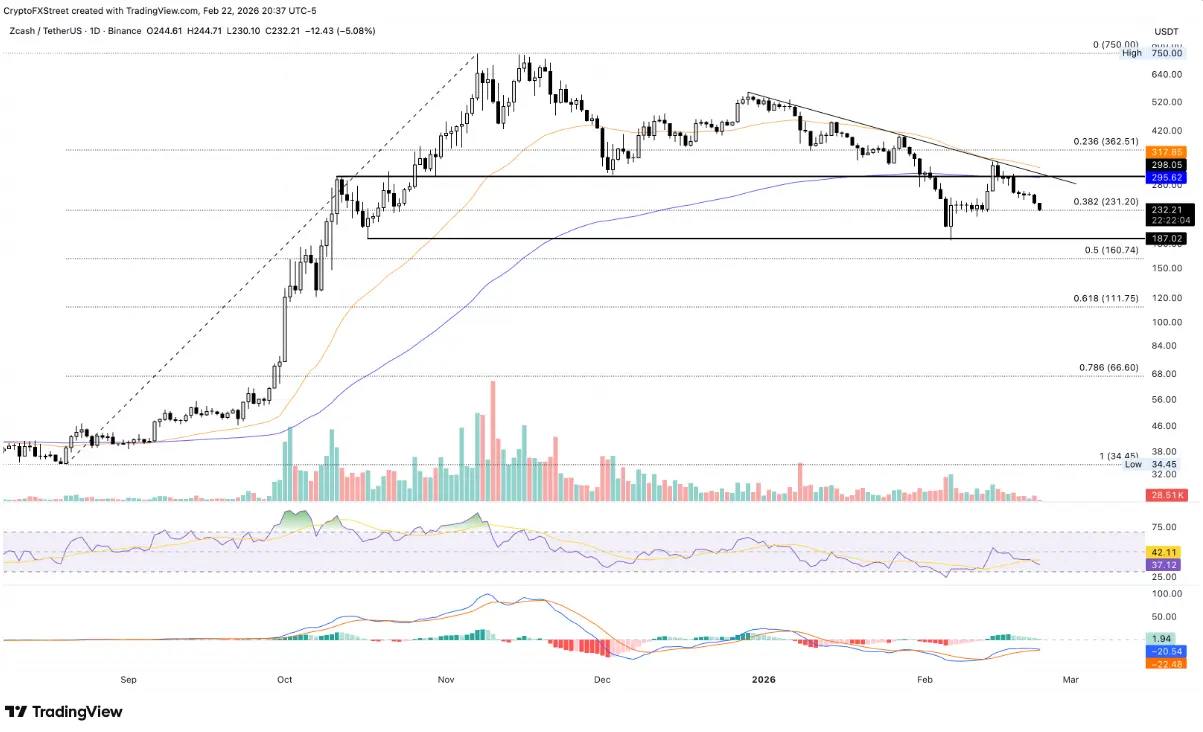 Daily ZEC/USDT chart | Source: TradingView From a trend perspective, the 50-day exponential moving average (EMA) is trending downward and currently around $317, approaching the 200-day EMA at $295. This development increases the risk of a “death cross” — a bearish technical signal. Maintaining below these declining EMAs further reinforces the short-term bearish outlook.
Momentum indicators on the daily chart also suggest sellers are regaining control. The RSI at 37 continues to fall into oversold territory as selling pressure intensifies. Meanwhile, the MACD line is approaching the signal line, with the histogram bars shrinking, increasing the likelihood of a bearish crossover.
In a more optimistic scenario, if Zcash can rebound from the $231 support zone, the price may test the 200-day EMA near $295 again.
Pump.fun Continues to Plummet Amid Persistent Selling Pressure
Pump.fun continues its downward trend, losing nearly 7% at the time of writing on Monday and falling below the key psychological support of $0.002000. Currently, the “least resistance” path for the price points directly toward the support at $0.001678 — the December 24 low, which previously served as a base for a short-term recovery on February 6.
A more negative scenario would materialize if the price decisively closes below $0.001678, allowing the decline to extend toward the S2 pivot at approximately $0.001199.
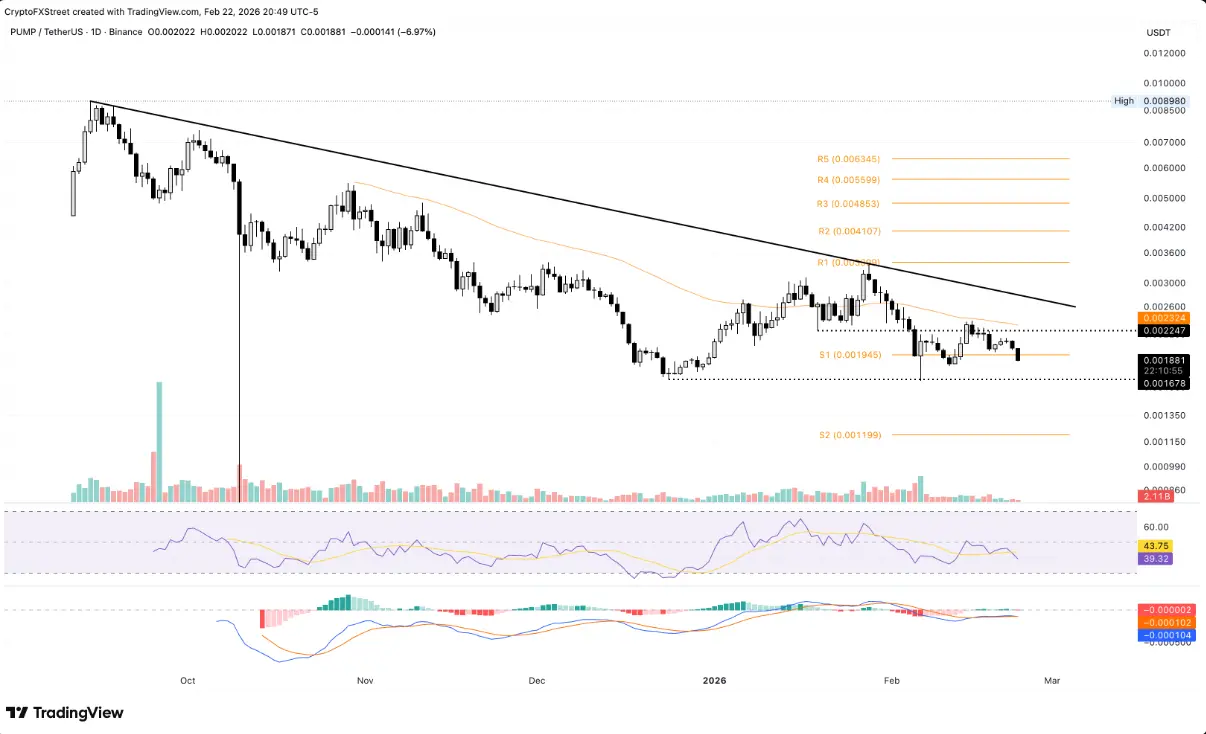 Daily PUMP/USDT chart | Source: TradingView From a technical standpoint, signals on the daily chart continue to favor the bears. Selling pressure increases as RSI drops to 39 and continues to move away from the midline, indicating room for further decline before reaching oversold levels. Additionally, the MACD has crossed below the signal line, confirming a bearish crossover and reinforcing the short-term negative outlook.
Conversely, if a rebound occurs, the 50-day EMA at $0.002325 is likely to act as the nearest resistance zone, hindering the price’s recovery efforts.
LayerZero Faces Pressure as Moving Averages Suppress Recovery
LayerZero has declined over 5% at the time of writing on Monday, approaching the psychological support level around $1.500. The ZRO token is currently trading below both the 50-day and 200-day EMAs — two key moving averages stacked in a bearish structure, indicating that the negative trend remains dominant and selling pressure persists.
Notably, the 200-day EMA has acted as a strong barrier, halting the price’s attempt to recover on Sunday. This rejection led to a roughly 5% correction, pushing ZRO back below the 50-day EMA and further confirming the short-term weakening scenario. The nearest support zone is at the February 6 low around $1.356; if this level is broken, the price could continue to fall toward the stronger support at the S1 pivot, approximately $1.177.
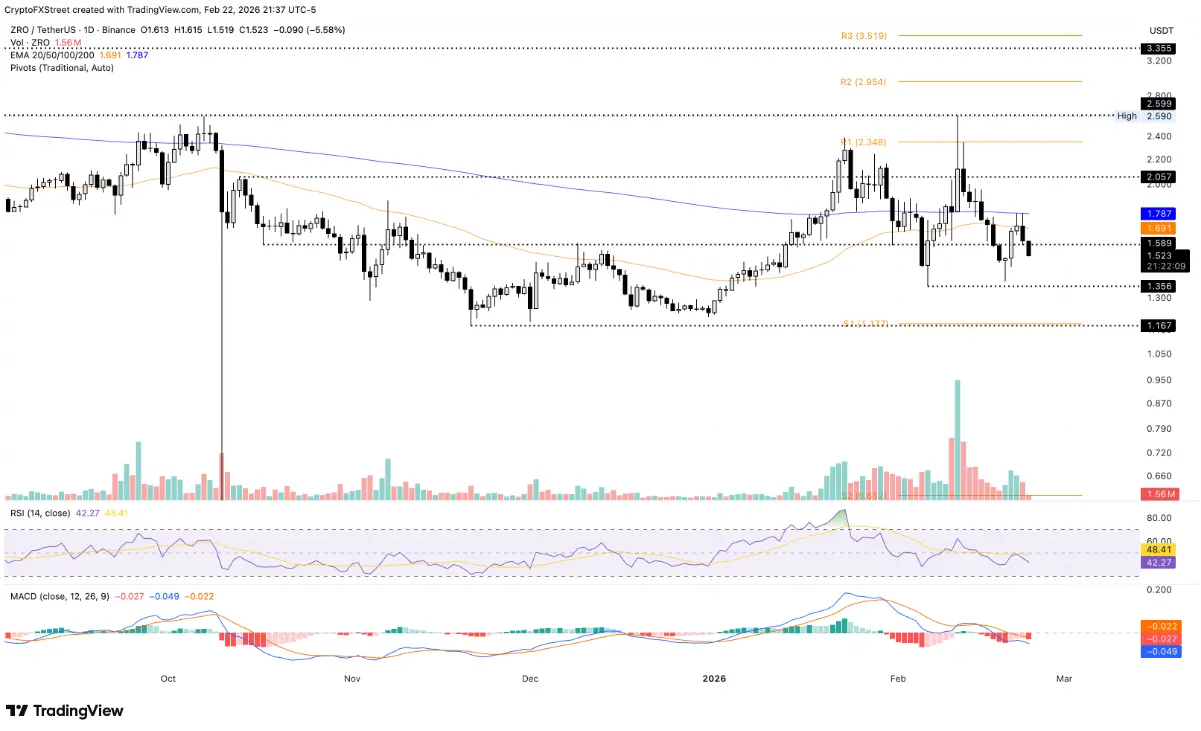 Daily ZRO/USDT chart | Source: TradingView Regarding momentum, the RSI is at 42 and has turned downward from the neutral line as selling pressure increases. This indicates room for further decline before entering oversold territory. Meanwhile, the MACD and signal lines remain below zero, with the histogram bars expanding negatively — a clear sign that the selling trend is prevailing.
To regain upward momentum and reverse the trend, ZRO needs to break back above the 50-day and 200-day EMAs, currently at $1.691 and $1.787 respectively. Only by surpassing these key resistance levels can the bullish outlook be reestablished.
Disclaimer: The information on this page may come from third parties and does not represent the views or opinions of Gate. The content displayed on this page is for reference only and does not constitute any financial, investment, or legal advice. Gate does not guarantee the accuracy or completeness of the information and shall not be liable for any losses arising from the use of this information. Virtual asset investments carry high risks and are subject to significant price volatility. You may lose all of your invested principal. Please fully understand the relevant risks and make prudent decisions based on your own financial situation and risk tolerance. For details, please refer to
Disclaimer.
Related Articles
Maji Big Brother opened a 40x long position on BTC at an average price of $71,131
Gate News reports that on March 24, Hyperbot data shows that Brother Magji opened a 40x long position on BTC again, with an average price of $71,131 and a position value of $780,000. In addition, he also holds a 25x long position on ETH worth $11.547 million, with an unrealized profit of $60,000.
GateNews2m ago
BTC breaks below $71,000
Jinse Finance reports that BTC has broken below $71,000, currently trading at $70,989.77, with a 24-hour decline of 0.11%. The market is experiencing significant volatility, please ensure proper risk management.
金色财经_6m ago
Best Crypto Presale: DeepSnitch AI Rallies 205% as Investors Choose AI Tech Over Washed-Up Presales Like Bitcoin Hyper and BlockchainFX
European Bitcoin treasury companies are merging to survive, and doing it without selling a single coin. Sweden’s H100 Group is acquiring two Norwegian Bitcoin firms in an all-stock deal, jumping from 44th to 27th globally in Bitcoin treasury rankings overnight.
But while institutions are mergi
CaptainAltcoin18m ago
Analysts Grow More Confident Over Bitcoin’s Final Rally in 2026, Bullish Then Bearish
Analysts grow more confident over Bitcoin’s final rally in 2026.
A bullish rally is expected first before a major fall in prices.
The price of Bitcoin is expected to fall as far as the $30,000 price range.
The crypto community is once again pleased to see the price of BTC trading over t
CryptoNewsLand22m ago
Bitcoin Faces Two Price Scenarios as Strait of Hormuz Tensions Dominate Oil Market
Recent market analysis from Wintermute indicates that geopolitical tensions in the Strait of Hormuz could significantly impact Bitcoin prices in the short term. If transportation normalizes and oil stabilizes around $100 per barrel, Bitcoin might test resistance levels between $74,000 and $76,000. Conversely, if shipping restrictions persist or conflicts escalate, Bitcoin could drop to around $60,000 due to increased macroeconomic pressure and cautious investor sentiment.
TapChiBitcoin22m ago
Bitcoin ETFs Snap Three-Day Outflow Streak With $167M Inflows
U.S. spot Bitcoin ETFs saw a strong rebound with $167 million in net inflows, largely driven by BlackRock’s fund. In contrast, Ethereum ETFs continued to struggle with ongoing outflows. Despite weak market sentiment, institutional confidence in Bitcoin remains strong.
Coinfomania29m ago
