Aave is igniting a new hope for long-term investors, thanks to its strong price performance over the past two weeks.
Since hitting a bottom at $92.25 on Friday, February 6th, this DeFi protocol’s token has surged by 29.7%, indicating a clear demand for a bottom.
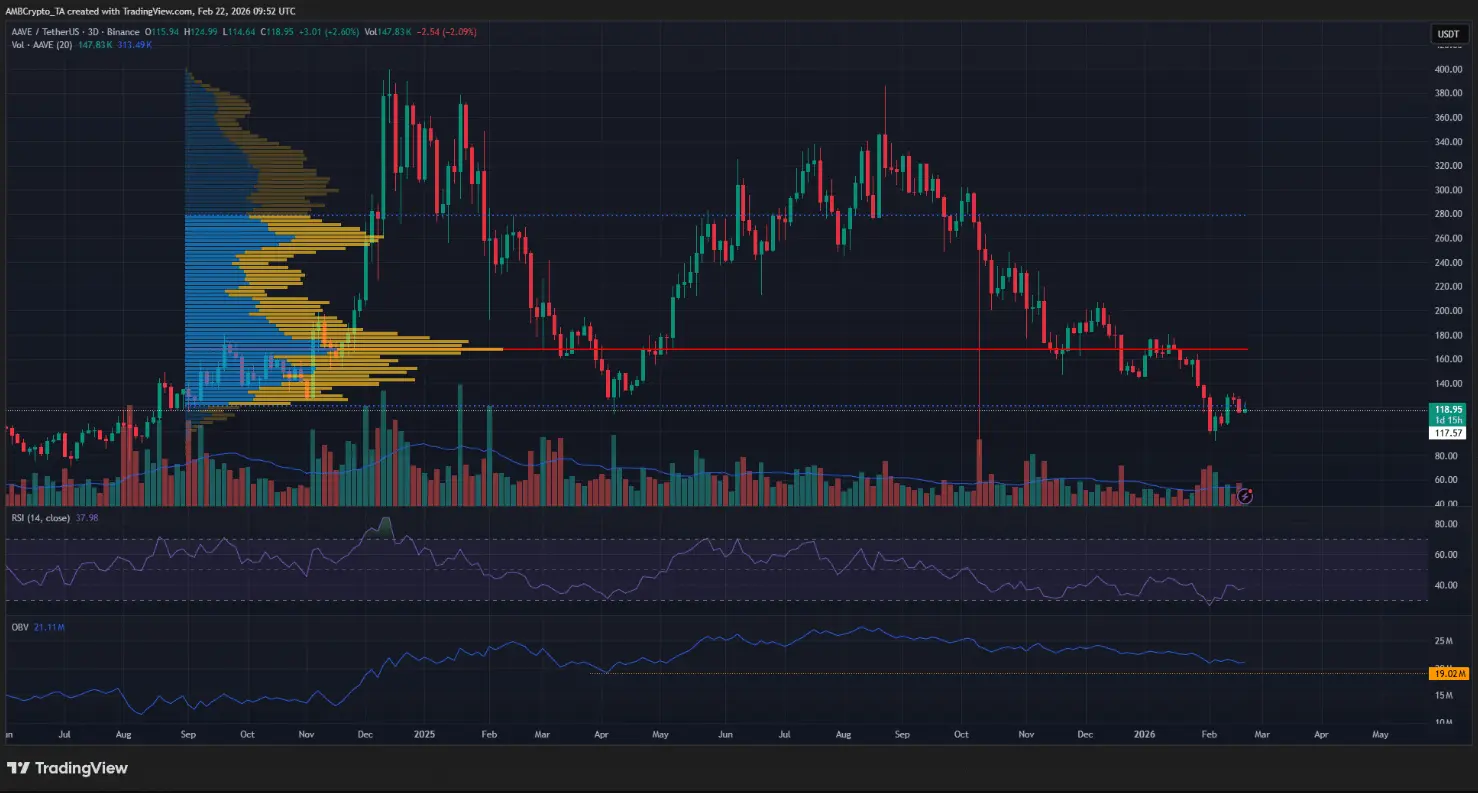 Daily BTC/USDT Chart | Source: TradingView As of writing, AAVE is trading around $119.64. However, from a broader perspective, the long-term trend of this asset still leans bearish.
The 3-day timeframe chart shows a weak technical structure, with a series of lower highs and lower lows forming continuously since the last week of September. This reflects ongoing selling pressure dominating in the medium term.
Notably, in summer 2024, the $117.57 level was a significant barrier to the bulls’ recovery efforts. After being broken in August 2024, this level paved the way for a strong rally, bringing AAVE close to $400 by the end of the year. Currently, the price is returning to this critical long-term trading zone.
The Fixed Range Volume Profile (FRVP), applied from the reversal point of support-resistance in August 2024 to now, shows the Value Area Low (blue dotted line) at $121.2, while the Point of Control (red) is at $168. These data highlight that long-term selling pressure still weighs heavily on AAVE. If the bulls cannot firmly defend the key demand zone of $80–$100, there is a significant risk of the price falling sharply to $50 by year-end.
On the positive side, the OBV indicator remains above the April 2025 lows — a sign that capital flow has not exited the market. Additionally, Aave’s revenue-generating capacity is still considered strong, according to Coin Photon reports, which helps bolster long-term bullish confidence.
Bearish signals for Aave
The total value locked (TVL) in the ecosystem once peaked at $27.7 billion but has declined to $26.3 billion over the past ten days. Notably, news that BGD Labs — one of the core service providers for Aave DAO — will withdraw in early April has exposed increasing internal rifts within the Aave ecosystem, negatively impacting investor sentiment.
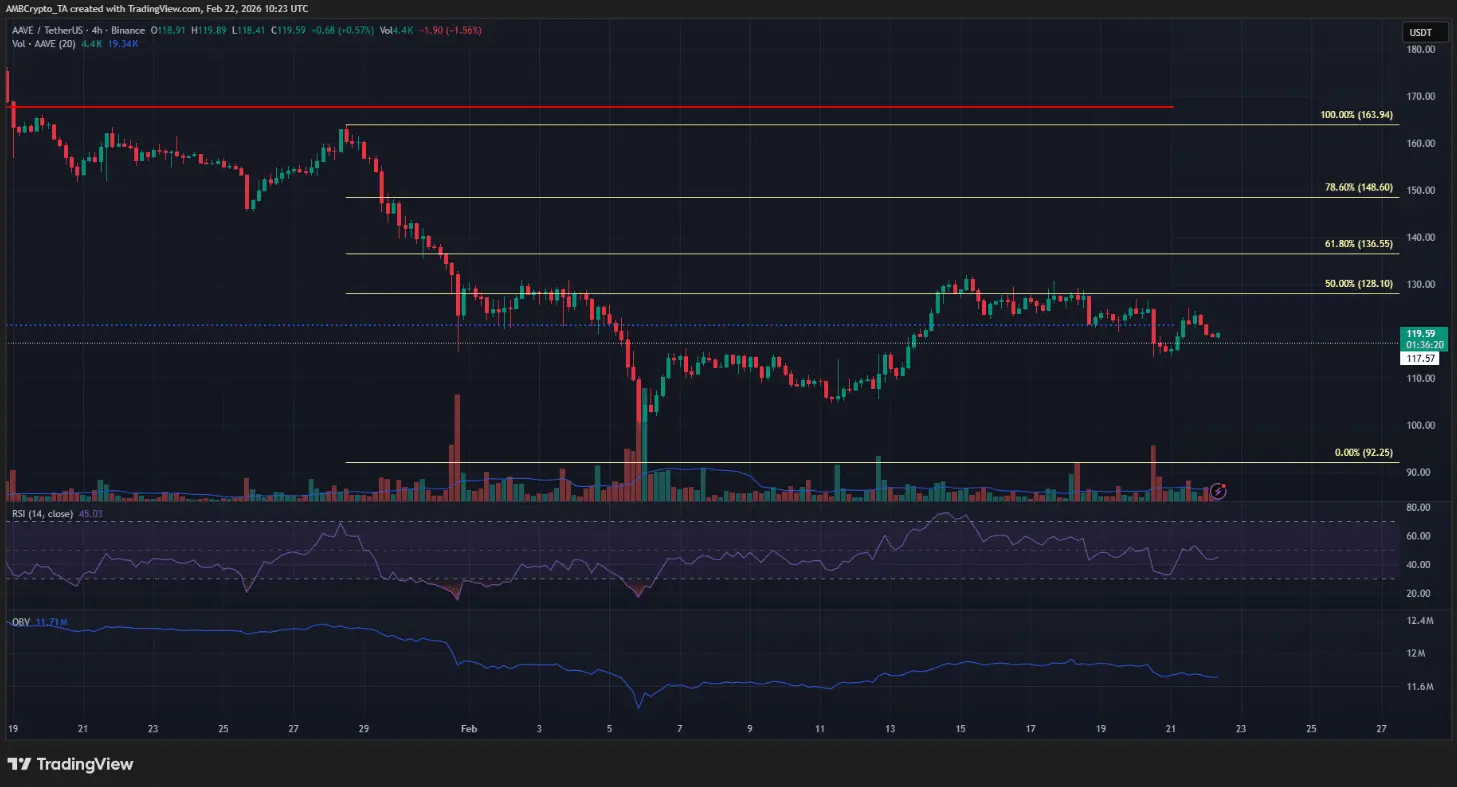 4-hour BTC/USDT Chart | Source: TradingView On the 4-hour timeframe, price action reflects significant market indecision around this altcoin. The $130 level has historically been an important supply zone throughout February. The repeated testing of this level suggests that a moderate upward push from Bitcoin could act as a catalyst for AAVE to break through this local resistance.
Conversely, the $148.6 level appears as a key resistance point. Given the prevailing long-term downtrend, a scenario where the price weakens approaching this zone is highly probable. However, if AAVE can decisively break above $163.9, it would confirm a structural shift to an uptrend and open room for a notable recovery.
Disclaimer: The information on this page may come from third parties and does not represent the views or opinions of Gate. The content displayed on this page is for reference only and does not constitute any financial, investment, or legal advice. Gate does not guarantee the accuracy or completeness of the information and shall not be liable for any losses arising from the use of this information. Virtual asset investments carry high risks and are subject to significant price volatility. You may lose all of your invested principal. Please fully understand the relevant risks and make prudent decisions based on your own financial situation and risk tolerance. For details, please refer to
Disclaimer.
Related Articles
Ethereum SuperTrend Indicator Turns Bullish for First Time in 10 Months As MVRV Ratio Hits Buy Zone
Expert trader Ali Martinez predicts a potential Ethereum (ETH) price surge following key indicators, including an ascending triangle formation and bullish MVRV ratio. Despite current volatility, optimism grows for a rebound above $3,600 if market conditions improve.
ZyCrypto19m ago
Productive Stablecoins: Closing the $300B Efficiency Gap
What to know:
The Problem: 90% of stables are "dead weight." Issuers take your fiat, buy T-bills, and keep 100% of the yield - a massive "hidden tax" on users.
The Opportunity: Over $11B in DAO treasuries and $1.2B in DEX liquidity is currently unproductive.
Emerging Solutions:
I
CoinDesk38m ago
XRP slides toward $1.35 as liquidation wave signals weak support
XRP has dropped to around $1.35 after a sharp sell-off, influenced by forced liquidations and bearish trader sentiment. The price remains under $1.40, with key support at $1.35 that could determine future volatility and direction.
CoinDesk43m ago
Ukraine's raid disrupts the oil market, Trump's plan is thwarted, and Bitcoin faces the risk of falling below $65,000.
Geopolitical conflicts are reshaping global financial markets, with the situations in Iran and Ukraine leading to rising energy prices, affecting the Federal Reserve's interest rate hike expectations and Bitcoin's value. Analysis indicates that rising energy costs will drive inflation, and the market is focused on Bitcoin's support levels.
GateNews1h ago
Bitunix Analyst: War Delay and Liquidity Contraction Resonance, BTC Stuck in 65K–72K Liquidation Zone
Global market performance looks stable on the surface, but internal imbalances remain. Geopolitical risks still exist. Countries are withdrawing liquidity and stabilizing their domestic currencies through different measures; the inflation logic has shifted somewhat, and a strengthening U.S. dollar reflects liquidity being withdrawn. In the crypto market, BTC is consolidating within a range-bound, choppy zone, with price volatility kept in check. In the short term, it’s necessary to watch for changes in the macro environment to find a trend breakout.
BlockBeatNews1h ago
