Pepe (PEPE) is currently trading steadily around the $0.0000048 mark as of Tuesday, after experiencing a surge of more than 16% over the past week. On-chain data along with developments in the derivatives market continue to send positive signals, indicating room for growth as whale accumulation activity increases, alongside expanding long positions. Technically, if the current bullish momentum persists, PEPE is likely to test the nearest resistance zone around $0.0000052 in the near future.
On-chain and Derivatives Data Indicate Upward Trend
Supply Distribution data from Santiment supports the bullish scenario for PEPE, as whales continue to take advantage of price corrections to accumulate this frog-themed meme coin.
Specifically, wallets holding from 100,000 to 1 million tokens (red line), 1 to 10 million tokens (yellow line), and 10 to 100 million tokens (green line) have accumulated a total of 11.82 billion PEPE since February 11. This large-scale net buying activity demonstrates increasing confidence among major investors regarding PEPE’s prospects.
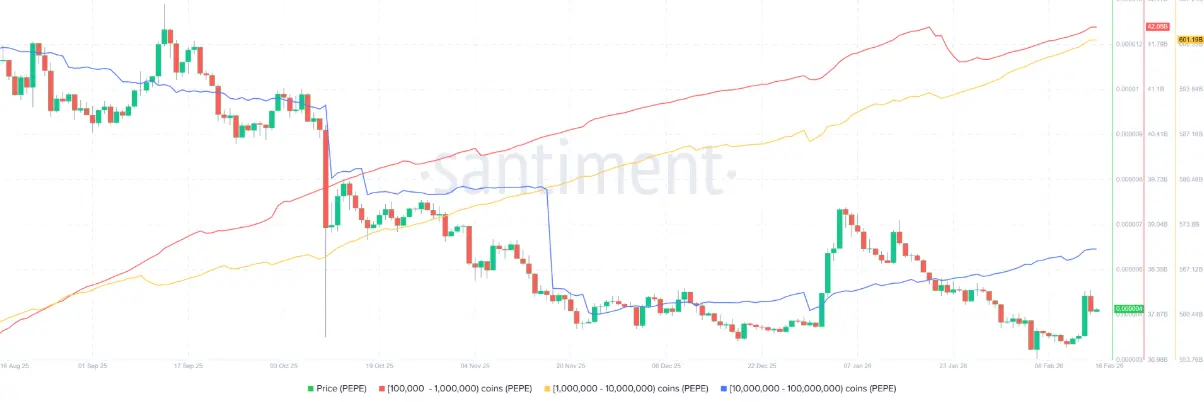 Pepe Supply Distribution Chart | Source: Santiment
Moreover, on-chain data shows Pepe’s transaction volume (total volume generated from on-chain trading applications) spiked to 905.99 million on Sunday — the highest since mid-January — before settling at 744.80 million on Monday. The rising liquidity and market interest are positive signals, fueling the upward trend.
Pepe Supply Distribution Chart | Source: Santiment
Moreover, on-chain data shows Pepe’s transaction volume (total volume generated from on-chain trading applications) spiked to 905.99 million on Sunday — the highest since mid-January — before settling at 744.80 million on Monday. The rising liquidity and market interest are positive signals, fueling the upward trend.
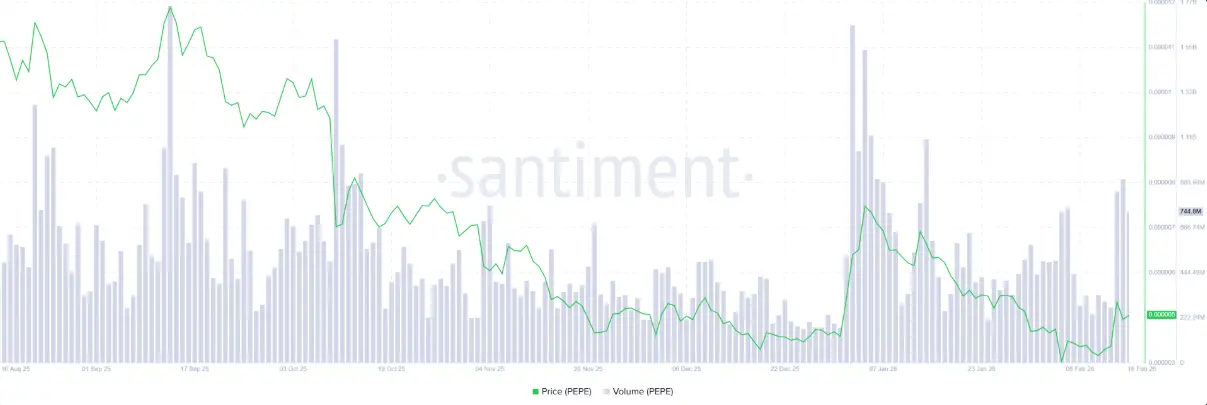 PEPE Trading Volume Chart | Source: Santiment
In the derivatives market, PEPE’s long/short ratio on Coinglass reached 1.13 on Monday, approaching a one-month high. Maintaining this ratio above 1 reflects optimistic sentiment, as most traders lean toward the scenario of PEPE’s price continuing to rise.
PEPE Trading Volume Chart | Source: Santiment
In the derivatives market, PEPE’s long/short ratio on Coinglass reached 1.13 on Monday, approaching a one-month high. Maintaining this ratio above 1 reflects optimistic sentiment, as most traders lean toward the scenario of PEPE’s price continuing to rise.
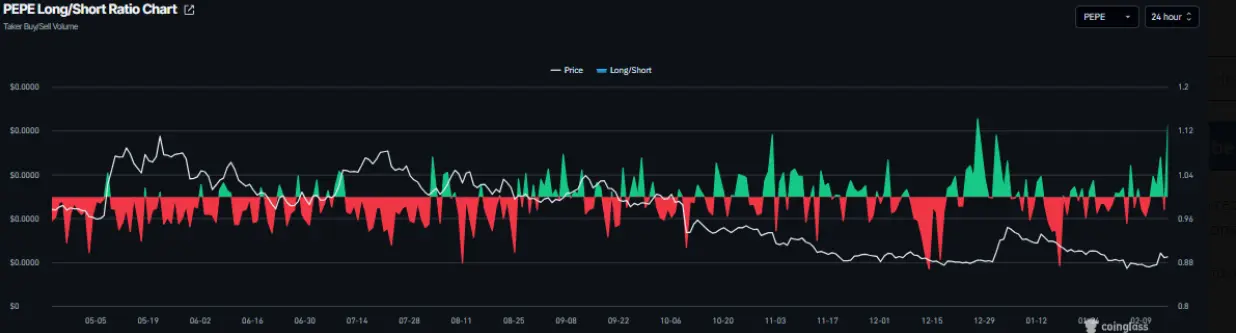 Pepe Long/Short Ratio Chart | Source: Coinglass
Pepe Price Forecast: Momentum Indicators Show Early Signs of Recovery
PEPE’s price has gained more than 16% over the past week, closing above the 50-day EMA at $0.0000046 on Saturday, before a slight correction on Sunday. As of Tuesday, PEPE remains oscillating around the 50-day EMA, maintaining a price near $0.0000046.
In a positive scenario, if the recovery trend continues, PEPE could extend its rally toward the nearest resistance zone at $0.0000052, coinciding with the 100-day EMA. A solid close above this level could set the stage for further gains, targeting the 200-day EMA at $0.0000065.
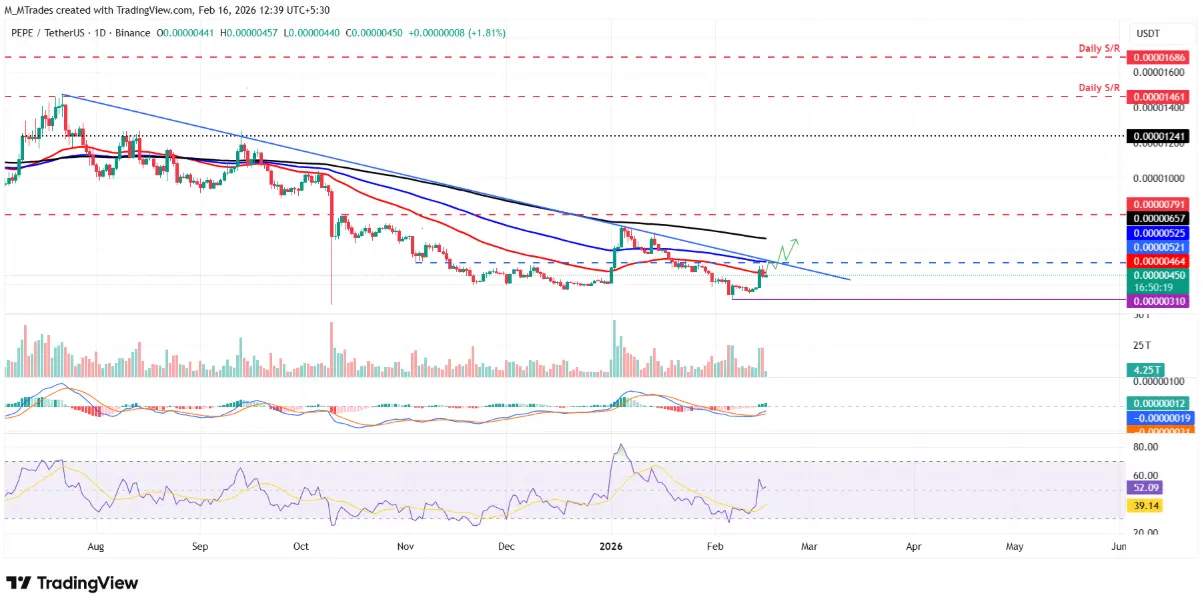 Daily PEPE/USDT Chart | Source: TradingView
From a technical indicator perspective, the daily RSI stands at 52, slightly above the neutral 50 level, indicating that bullish momentum is gradually building. Additionally, the MACD has confirmed a bullish crossover on Saturday, further supporting the short-term recovery outlook.
Daily PEPE/USDT Chart | Source: TradingView
From a technical indicator perspective, the daily RSI stands at 52, slightly above the neutral 50 level, indicating that bullish momentum is gradually building. Additionally, the MACD has confirmed a bullish crossover on Saturday, further supporting the short-term recovery outlook.
Conversely, if selling pressure resumes, PEPE risks weakening and retesting the February 6 bottom at $0.0000031.
Disclaimer: The information on this page may come from third parties and does not represent the views or opinions of Gate. The content displayed on this page is for reference only and does not constitute any financial, investment, or legal advice. Gate does not guarantee the accuracy or completeness of the information and shall not be liable for any losses arising from the use of this information. Virtual asset investments carry high risks and are subject to significant price volatility. You may lose all of your invested principal. Please fully understand the relevant risks and make prudent decisions based on your own financial situation and risk tolerance. For details, please refer to
Disclaimer.
