
Bitcoin is trading around $68K right now, but a CryptoQuant chart making the rounds is putting a much lower number back on the table: $39K. The logic comes from one of the most watched on-chain “line in the sand” metrics in crypto cycles — realized price.
- What the BTC chart is showing
- What “realized price” means in plain English
- How realistic is $55K… and the $39K flush?
- The levels that matter from here
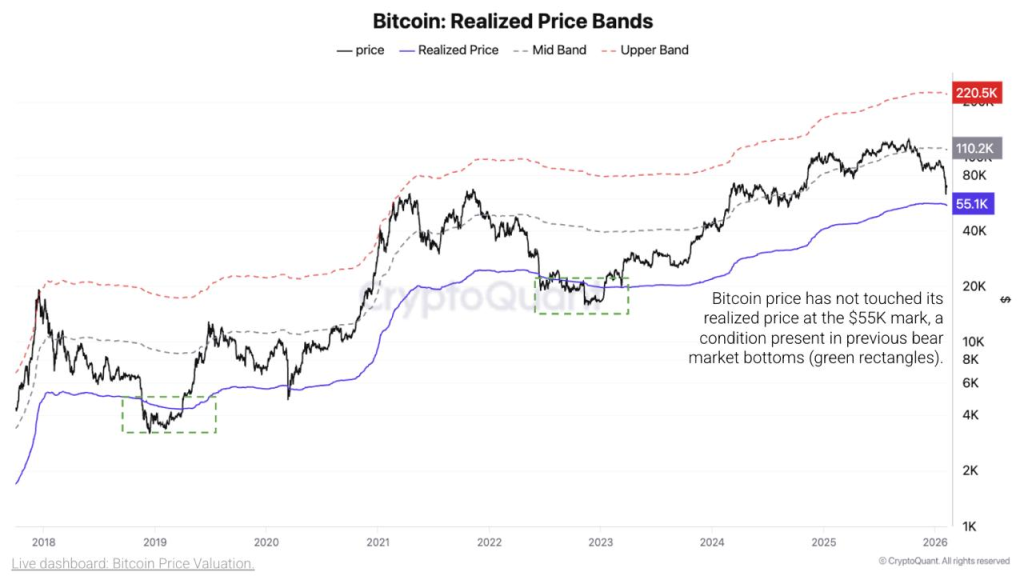
What the BTC chart is showing
The chart plots Bitcoin’s market price (black) against realized price (blue), plus a set of bands above it. On the right side, the realized price level sits near $55.1K.
The key observation: in prior bear market bottoms, Bitcoin didn’t bottom until price came down to realized price (the green-highlighted zones on older cycles). In the current cycle, price has not tagged that realized-price line yet.
Those dashed bands matter for context, too. They act like valuation zones across cycles:
- The realized price acts like a “cost basis anchor” for the market.
- The higher bands map out hotter valuation zones that usually show up in full-risk-on phases.
Source: X/@coinbureau
What “realized price” means in plain English
Realized price is basically Bitcoin’s average** on-chain cost basis**: it values each coin at the last price it moved on-chain, then averages that across the supply. Put simply, it estimates what the market, as a whole, paid for its BTC.
Why traders care: when Bitcoin trades above realized price, the average holder is in profit. When it trades at or below realized price, the market is under stress and capitulation dynamics show up more often.
It’s not a magic bottom button, but it’s one of the cleaner “where does pain peak” gauges that tends to matter most during deep drawdowns.
How realistic is $55K… and the $39K flush?
From $68K to $55K is a drop of about 19%. That’s completely plausible in crypto terms, especially during a volatility spike or a broader risk-off move.
The more extreme number comes from the historical note baked into the post: in past cycles, Bitcoin pushed 24–30% below it before the final low printed.
If realized price is ~$55K:
- 24% below is about $41.8K
- 30% below is about $38.5K
That’s where the $39K headline comes from. It’s basically a “full capitulation” scenario where the market overshoots the average cost basis before stabilizing.
The reality check: a drop to $39K would require a much more aggressive unwind than a normal pullback. It would likely need a sharp liquidity event, a macro shock, or a broad deleveraging wave that forces sellers to dump into a thin bid.
Read also: AI is Coming For Your Stocks – Here’s What You Need to Know
The levels that matter from here
If this realized-price framework is the lens, then the map is straightforward:
- $68K (current area): market still holding above the “pain line,” but not far enough to dismiss a deeper reset.
- $60K: a psychological and structural zone that tends to get defended first.
- $55K (realized price): the key level CryptoQuant is flagging as the classic bear-market bottom condition.
- $42K–$39K: the “overshoot” zone if panic selling drives a final flush below realized price.
If Bitcoin holds above the low $60Ks and keeps bouncing, the realized-price tag may never happen this cycle. If momentum breaks and $60K fails decisively, realized price becomes the next major magnet.
Bottom line: $55K is the realistic stress-test level. $39K is the capitulation tail-risk level that becomes relevant only if the market gets forced into a hard reset.
Read also: Bitcoin at $60K Could Be the Deal of the Decade
Disclaimer: The information on this page may come from third parties and does not represent the views or opinions of Gate. The content displayed on this page is for reference only and does not constitute any financial, investment, or legal advice. Gate does not guarantee the accuracy or completeness of the information and shall not be liable for any losses arising from the use of this information. Virtual asset investments carry high risks and are subject to significant price volatility. You may lose all of your invested principal. Please fully understand the relevant risks and make prudent decisions based on your own financial situation and risk tolerance. For details, please refer to
Disclaimer.
Related Articles
South Korea Records 60 Billion USD Crypto Outflows, Domestic Exchange Profits Plummet
In the second half of 2025, South Korea experienced a $60 billion outflow of crypto capital, mainly driven by arbitrage and cross-border trading. Domestic participation grew with increased accounts and deposits, yet exchange profits and trading volume declined, highlighting regulatory impacts.
TapChiBitcoin15m ago
Yesterday, US Bitcoin spot ETF net inflows were $7.77 million, with Fidelity FBTC inflows of $83.34 million.
Gate News: On March 26, according to monitoring by crypto analyst Trader T, US Bitcoin spot ETFs saw net inflows of 7.77 million USD on March 25. Specifically, BlackRock's IBIT saw net outflows of 70.75 million USD, Fidelity's FBTC saw net inflows of 83.34 million USD, and Ark Invest's ARKB saw net outflows of 4.82 million USD.
GateNews32m ago
CryptoQuant: Strategy-Led Enterprise BTC Reserve Demand, Other Institutional Participation Drops 99% Year-over-Year
CryptoQuant data shows that over the past 30 days, Strategy has accumulated approximately 45,000 BTC in purchases, while other companies have only purchased around 1,000 BTC, a decline of approximately 99%. Strategy holds 76% of corporate bitcoin reserves, indicating a lack of enterprise-level BTC demand in the market and an imbalanced institutional participation landscape.
GateNews33m ago
Stagflation 2.0 Signal Exposed: Gold and Oil Divergence, Bitcoin Converges Toward Digital Gold
Recently, Brent crude oil prices have declined while gold continues to rise, displaying stagflationary market characteristics. Bitcoin's price movement has gradually decoupled from oil and shifted toward tracking gold, reflecting institutional investors' view of it as a hedge asset. The Federal Reserve's high interest rate policy has intensified market concerns about inflation and economic growth slowdown. This phenomenon is historically closely associated with major macroeconomic shifts.
MarketWhisper1h ago
Accumulated Profits of $16.39 Million, Whale Opens $7.09 Million BTC Long and $982,000 LIT Long on Hyperliquid
Gate News, March 26: According to Onchain Lens monitoring, a Hyperliquid whale suspected to be associated with NervousDegen, with accumulated profits and losses of +$16.39 million, has recently opened new long positions. The address opened 100 BTC longs (40x leverage) with a notional value of approximately $7.09 million; simultaneously opened 1 million LIT longs (5x leverage) with a notional value of approximately $982,000. Additionally, the address currently holds 75,160 HYPE spot and staking positions with a combined value of approximately $3.01 million.
GateNews1h ago
