In brief
- Bitcoin bounced to above $69K after testing $60K lows, up 3.69% in 24 hours, but the daily chart shows strong bearish momentum.
- On Myriad, traders are pricing in 55% odds that Bitcoin touches $55K before recovering, reflecting persistent bearish sentiment.
- The Crypto Fear and Greed Index sits at 8—nearly an all-time low and in “extreme fear” territory.
The crypto market is still in full panic mode. The Crypto Fear and Greed Index sits at 8 points—extreme fear territory—just barely above the all-time low of 5 hit on February 6.
But even in a sea of red, there’s some hopium for degens to breathe. The global crypto market cap ticked up 4.3% today to $2.36 trillion, but that’s a modest bounce considering that around $2 trillion have been wiped out in recent weeks.
On Myriad, a prediction market developed by Decrypt’s parent company Dastan, traders are pricing in 55% odds that Bitcoin touches $55,000 before recovering to $84,000. That’s not exactly a vote of confidence. Meanwhile, British multinational bank Standard Chartered slashed its Bitcoin target from $300,000 to the $100K zone, warning the coin could crash to $50K first. Bitcoin ETF outflows also shed $410 million yesterday, as traders show even the most bullish can panic when red candlesticks populate their charts.
Today’s CPI data release could decide whether this bounce extends or collapses. Analysts expect inflation at 2.5% year-over-year. A hot print sends Bitcoin toward $60K. A cool one might give bulls breathing room.
Bitcoin (BTC) price: The bounce looks weak
Bitcoin rallied from $68,248 to an intraday high of $69,450 before settling around $69,321—up 3.69% in 24 hours. Not bad on the surface. But the bigger picture suggests you may want to keep your champagne on ice for a bit longer.
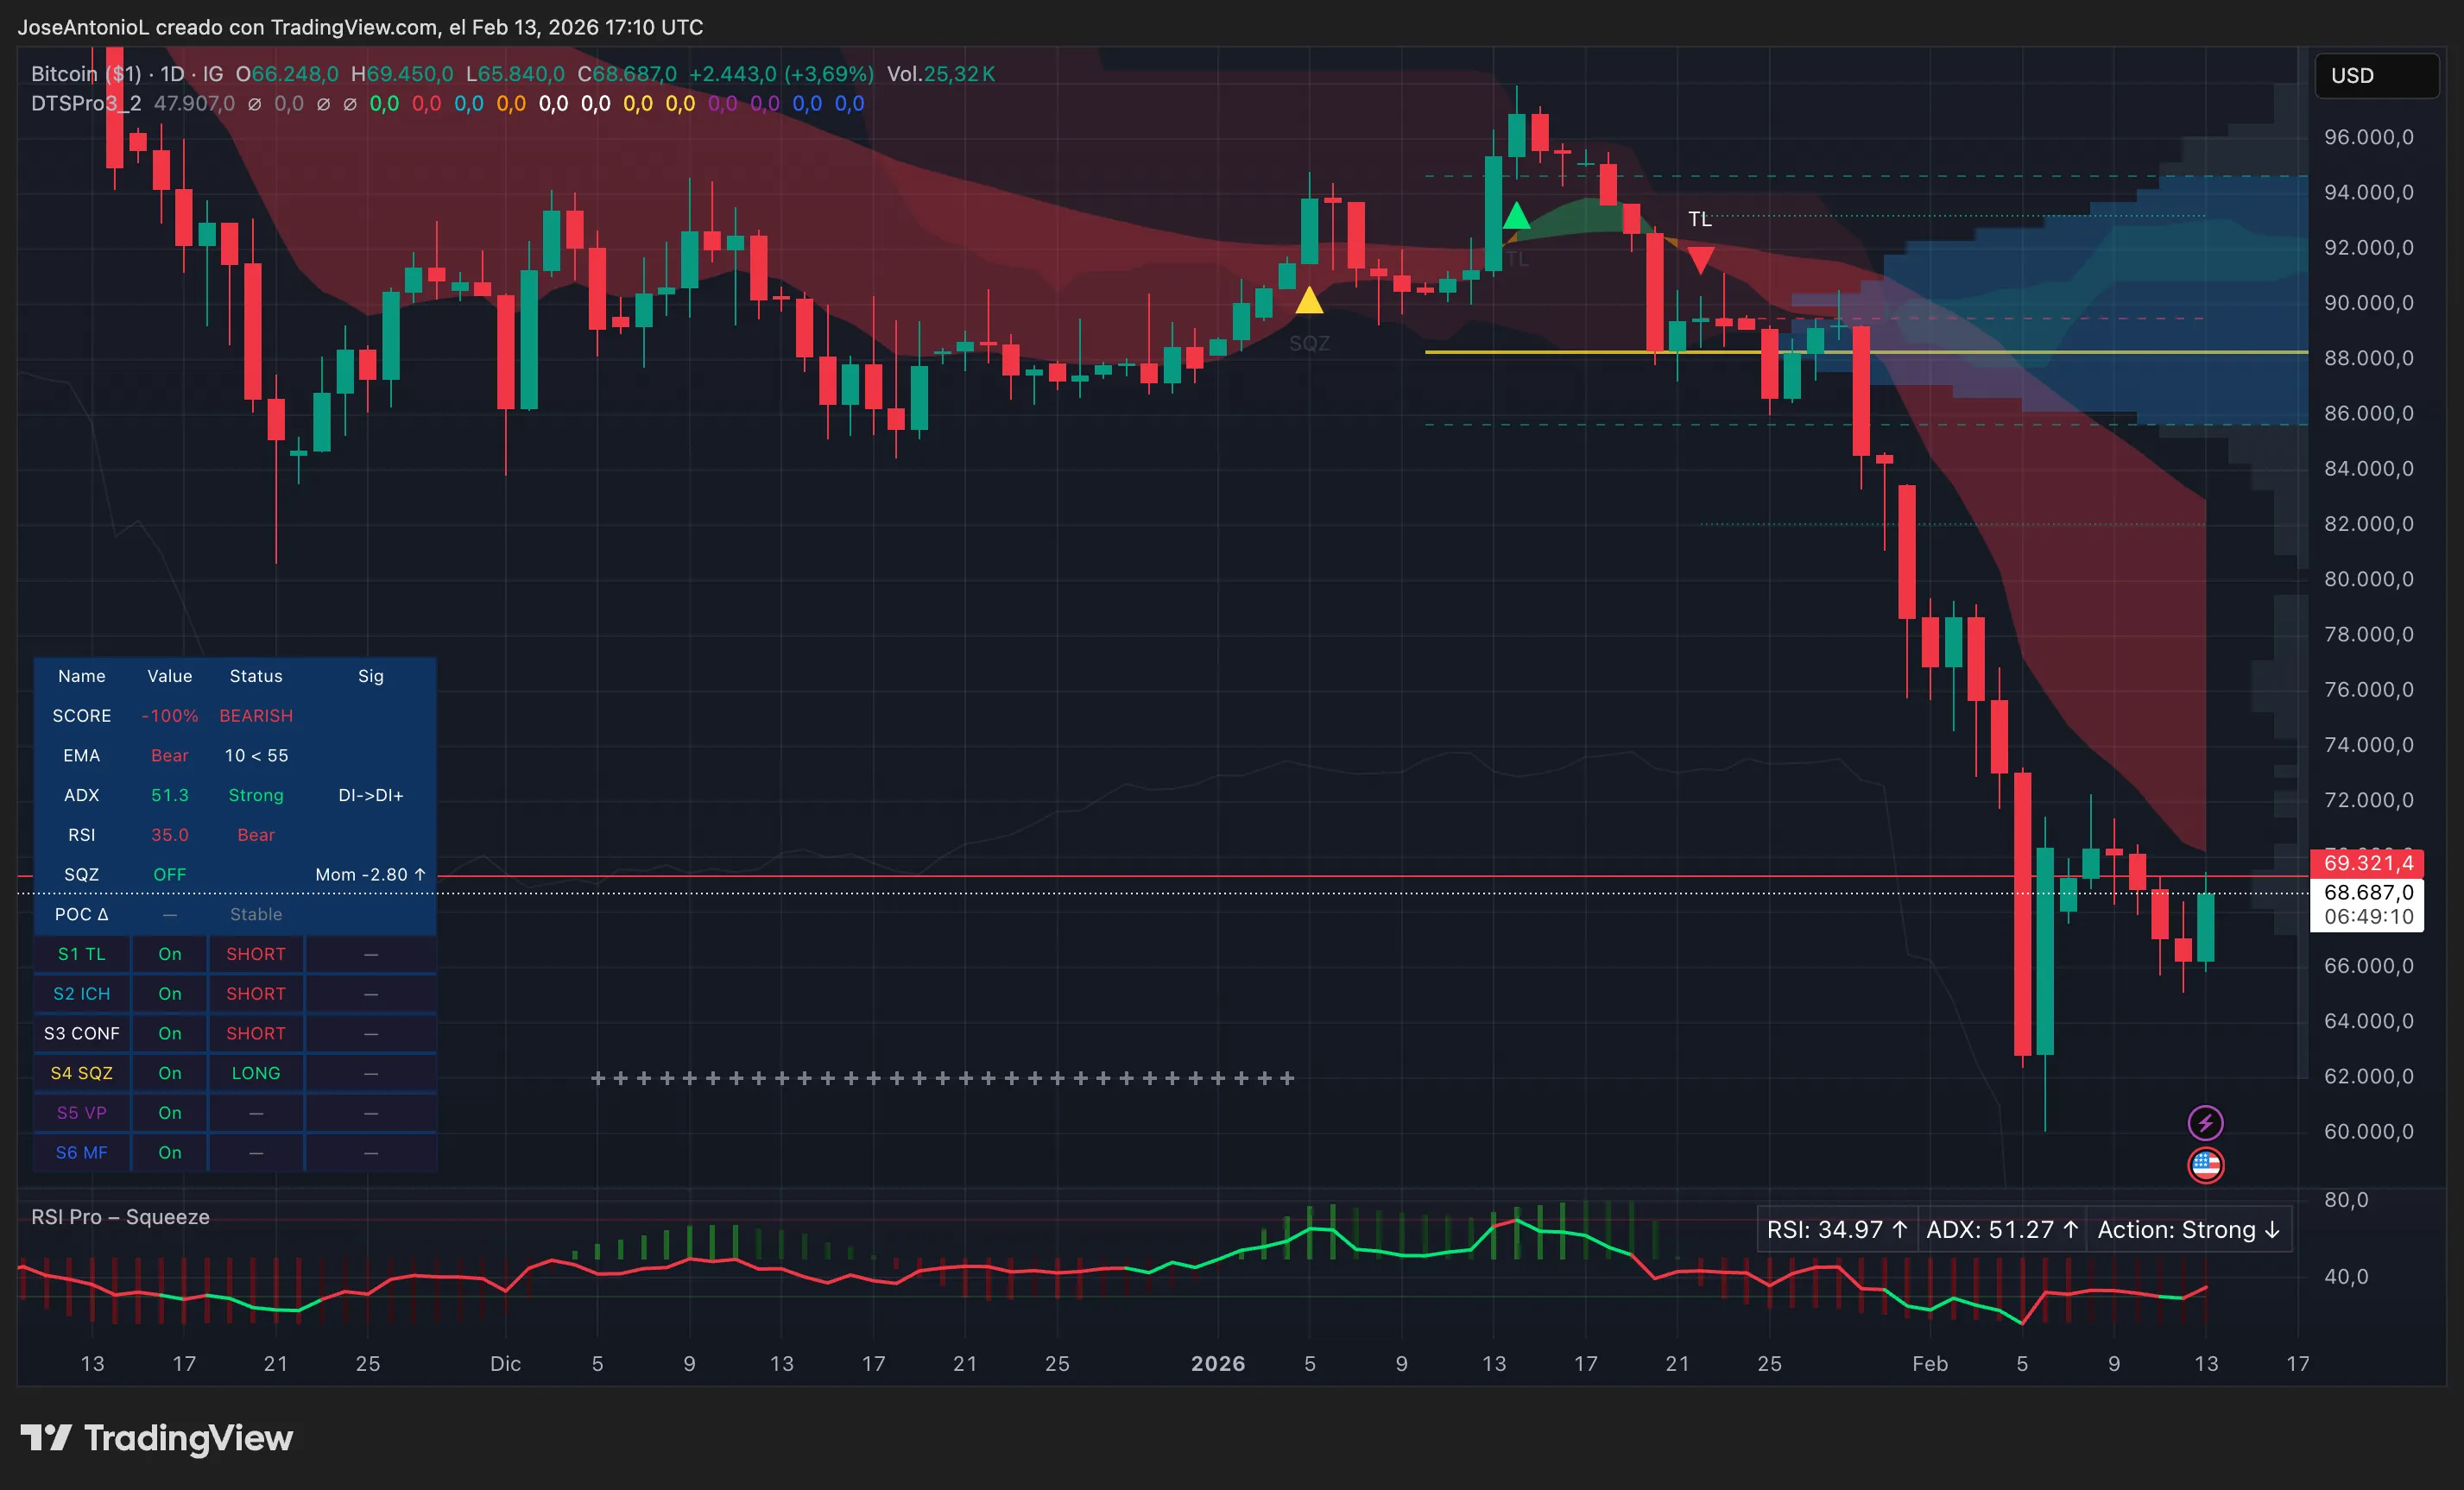
Bitcoin (BTC) price data. Image: Tradingview
The Average Directional Index, or ADX, sits at 51.3, signaling a strong bearish trend. ADX measures trend strength regardless of direction—readings above 25 confirm a trending market, and above 50 means conviction.
This recent bounce may lower the ADX numbers a bit, but it doesn’t mean Bitcoin has magically turned bullish. It just means you cannot be permabear, and it’s reasonable to expect “FUD” or “FOMO” episodes inside of solid trends.
The Relative Strength Index, or RSI, is at 35.0, firmly in bearish territory. RSI measures momentum from 0 to 100, with below 30 suggesting oversold conditions and above 70 overbought. At 35, Bitcoin has bounced off the $60K lows but remains far from neutral (50). Traders typically wait for RSI to break above 50 before calling a momentum shift. We’re not there yet.
The 50-day Exponential Moving Average, or EMA, trades well below the 200-day EMA—a classic bearish setup. EMAs help identify trend direction using weighted price averages. When the short-term EMA sits below the long-term one, recent price action is weaker than the broader trend. That creates a bearish structure.
Overall, Bitcoin bulls need another February 6-style candlestick—but bigger. A good second option could be a series of green daily closes pushing above $80,000, which would signal bulls are back. Until then, this is more likely noise inside a downtrend.
The 4-hour chart offers slightly better conditions for day traders and quick leverage plays.
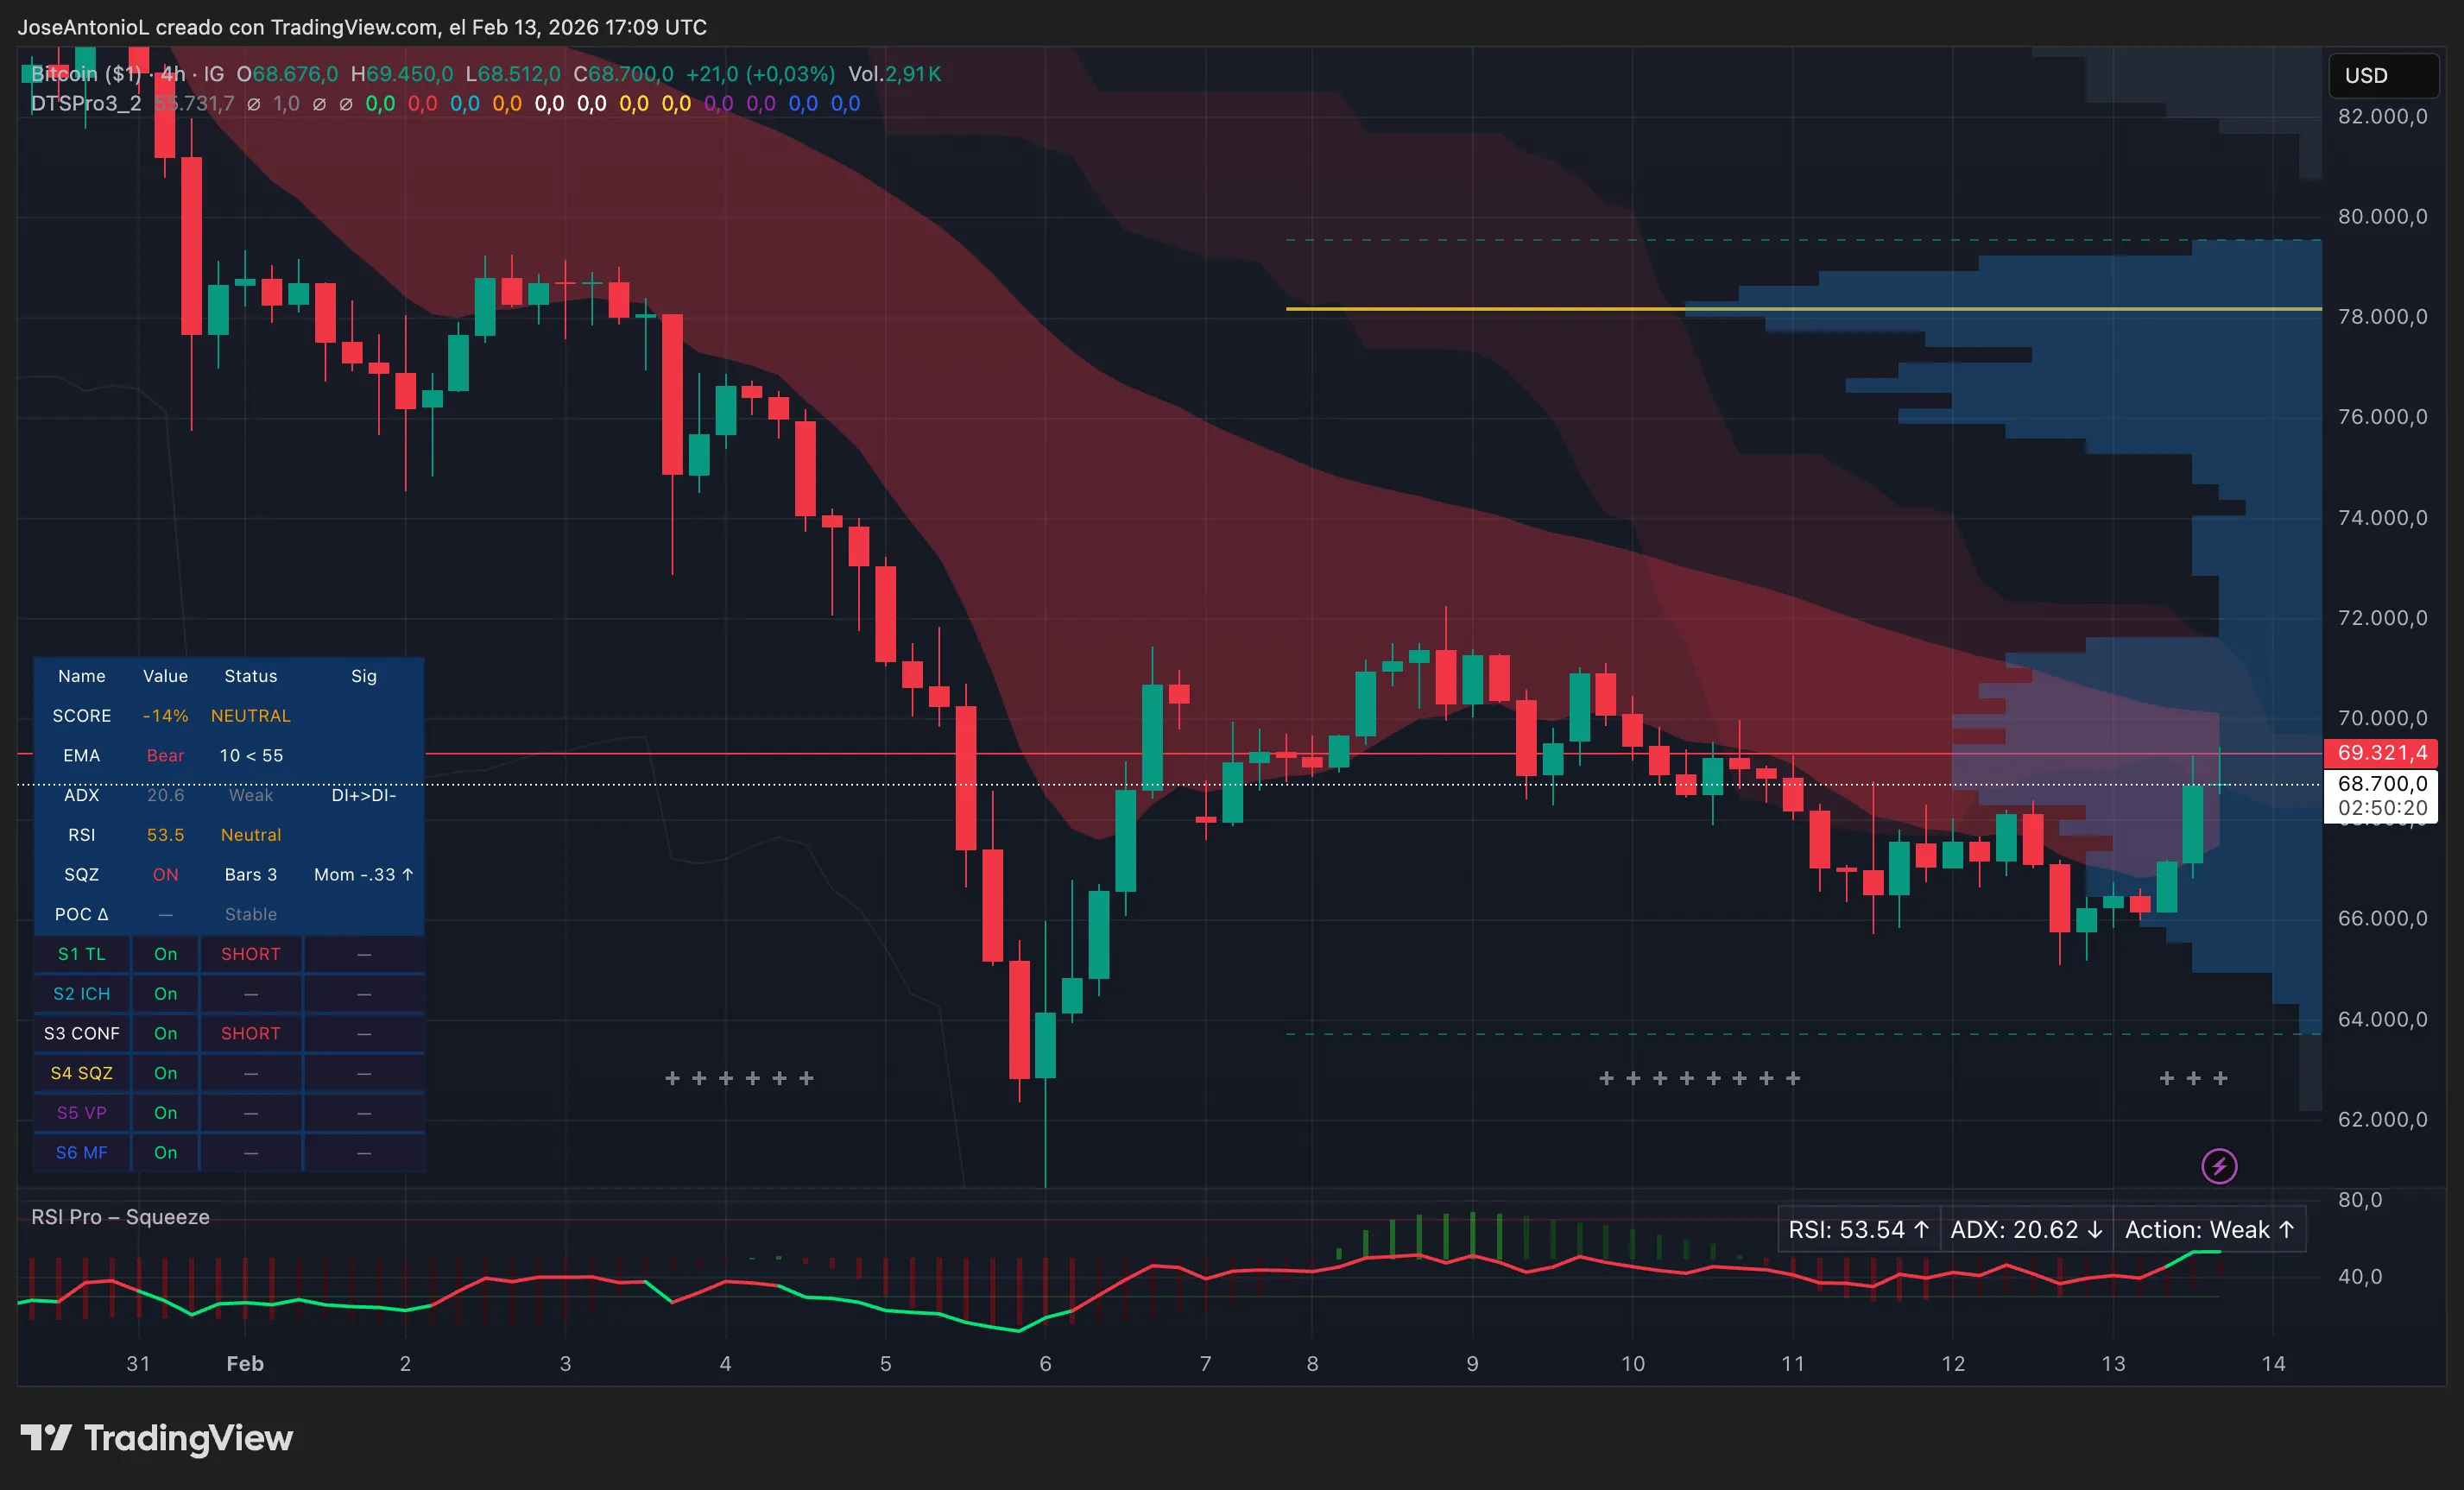
Bitcoin (BTC) price data. Image: Tradingview
The 4-hour ADX sits at 20.6 (weak, no clear trend) which is good for traders placing positions as Bitcoin bounces around between established supports and resistances. RSI at 53.6 is also neutral, and the Squeeze Momentum Indicator is “on,” suggesting compression before a move. But with the daily trend bearish, any 4-hour rally likely hits resistance hard. If you’re swing trading or holding, the daily trend is your boss.
This bounce isn’t enough to signal a trend reversal. The daily chart shows strong bearish momentum (ADX 51.3), weak RSI (35.0), and bearish EMAs. The 4-hour chart might let day traders scalp a move to $70K-$72K, but swing traders and holders would likely be wise to remain cautious.
Disclaimer: The information on this page may come from third parties and does not represent the views or opinions of Gate. The content displayed on this page is for reference only and does not constitute any financial, investment, or legal advice. Gate does not guarantee the accuracy or completeness of the information and shall not be liable for any losses arising from the use of this information. Virtual asset investments carry high risks and are subject to significant price volatility. You may lose all of your invested principal. Please fully understand the relevant risks and make prudent decisions based on your own financial situation and risk tolerance. For details, please refer to
Disclaimer.
Related Articles
BTC drops below 70,000 USDT
Gate News bot message: Gate market data shows BTC breaking below 70000 USDT, current price 69996.8 USDT.
CryptoRadar1m ago
Bitcoin may have already bottomed out near $60,000. Here’s why.
Some worry bitcoin BTC$70,639.39 could still see a deeper sell-off, but one key indicator suggests the bottom may already be behind us.
That indicator is the 30-day implied volatility, which is an options-based measure of expected price turbulence over four weeks.
The widely-tracked 30-day implie
CoinDesk2m ago
Strategy Acquires 1,031 BTC in Smaller Weekly Purchase
Strategy, led by Michael Saylor, purchased 1,031 BTC for $76.6M, bringing total holdings to 762,099 BTC. This more measured acquisition follows previous larger buys and is funded through common stock sales. Current holdings are valued around $54B, about 7% below acquisition cost.
CryptoFrontNews37m ago
# Gold and BTC Diverge: A Battle Over the Definition of Safe-Haven Assets
# Woke up, and BTC pulled back to 70k. On the drive this morning, the radio was reporting that gold came under pressure as the Fed's March FOMC meeting failed to meet rate cut expectations, erasing all gains for the year so far.
Recently, geopolitical tensions in the Middle East have escalated, causing global capital markets to shake. According to classical narratives in traditional finance, geopolitical conflicts should push up gold prices—a logic rooted in gold's thousands of years of safe-haven attributes, long since becoming the instinctive reaction of market participants. Yet the market performance in March 2026 has shattered this stereotype: gold prices continued to decline, breaking through the critical support level of $4,500, while Bitcoin's decline was far smaller than traditional risk assets like stocks, displaying a certain characteristic of "relative safe-haven."
This anomalous divergence, on the surface is a difference in asset price movements, but at a deeper level reflects a structural change long overlooked by the market: the investor base for gold and Bitcoin is undergoing a fundamental shift
金色财经_40m ago
