Maple Finance (SYRUP) is hovering around the $0.2700 USD mark at the time of recording on Friday, as buying pressure persistently protects the S1 Pivot support zone at $0.2497 USD. The steady price maintenance indicates that market sentiment is gradually stabilizing after recent fluctuations.
From an on-chain data perspective, demand for this DeFi protocol remains positive. Total Assets Under Management (AUM) has surpassed $4 billion USD, while revenue continues to hold steady after reaching a record high in January — a sign reinforcing investor confidence in the platform.
On the technical side, SYRUP is signaling a potential recovery as selling pressure appears to weaken, opening room for a new upward move if demand continues to be sustained.
Maple Finance Maintains Revenue, Attracts Whales
Data from Dune Analytics dashboards show that Maple Finance has generated $1.46 million USD in revenue so far this month, after hitting a record high of $2.57 million USD — mostly from lending activities and yield optimization strategies. This trend follows steady monthly growth, after the protocol recorded $2.49 million USD in December.
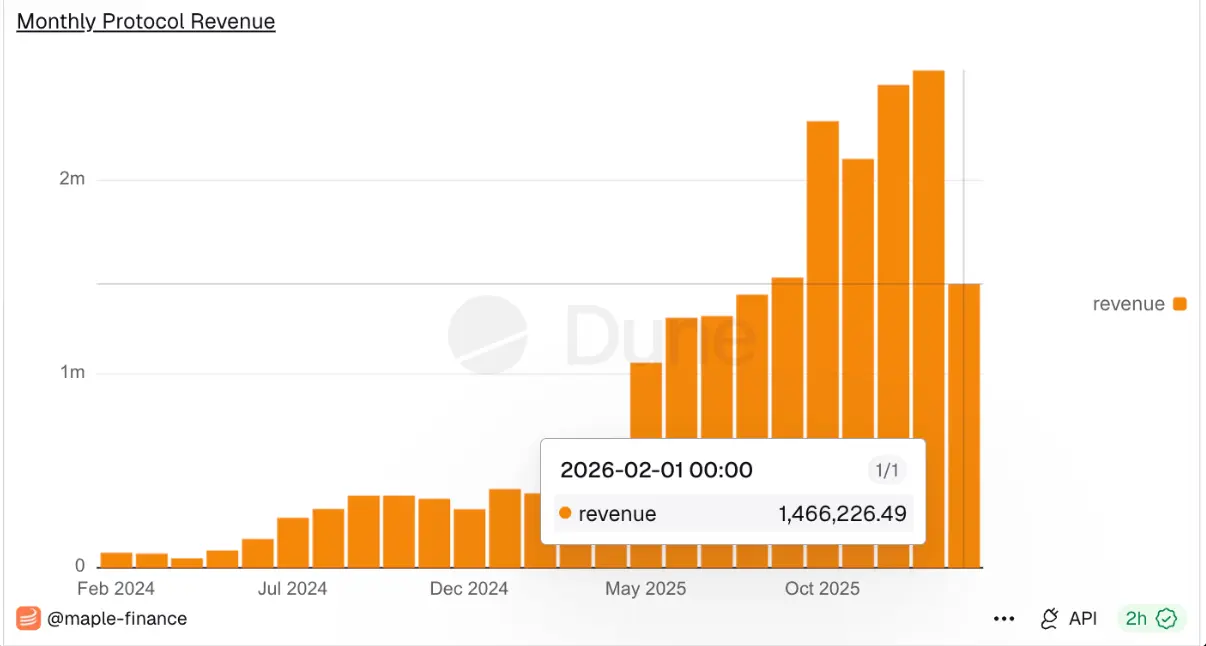 Monthly Revenue of Maple Finance | Source: Dune
Meanwhile, Maple Finance’s total assets under management (AUM) have exceeded $4 billion USD, with lending debt reaching $1.08 billion USD. The combination of stable revenue streams and expanding asset scale indicates that the protocol’s ecosystem is accelerating, benefiting from continuously rising market demand.
Monthly Revenue of Maple Finance | Source: Dune
Meanwhile, Maple Finance’s total assets under management (AUM) have exceeded $4 billion USD, with lending debt reaching $1.08 billion USD. The combination of stable revenue streams and expanding asset scale indicates that the protocol’s ecosystem is accelerating, benefiting from continuously rising market demand.
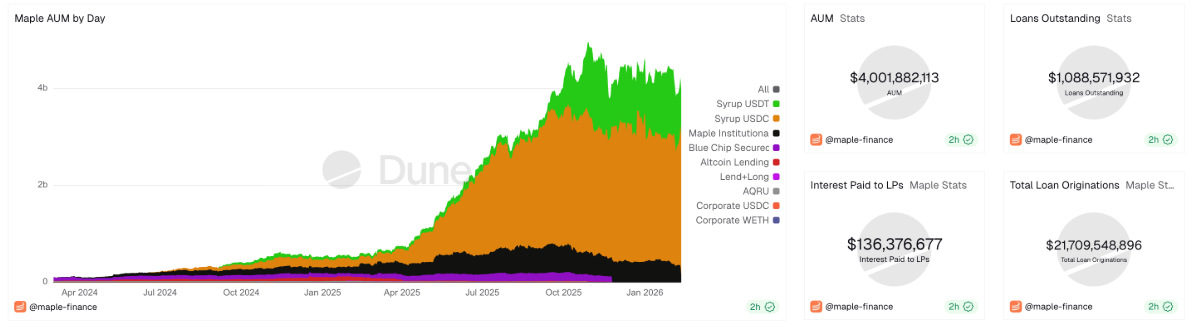 Maple Finance’s Total Assets Under Management (AUM) Data | Source: Dune
Further supporting this positive outlook, data from CryptoQuant shows stable interest from large investors — often called “whales” — as reflected by the average size of SYRUP orders in the spot market, indicating that significant capital is quietly accumulating.
Maple Finance’s Total Assets Under Management (AUM) Data | Source: Dune
Further supporting this positive outlook, data from CryptoQuant shows stable interest from large investors — often called “whales” — as reflected by the average size of SYRUP orders in the spot market, indicating that significant capital is quietly accumulating.
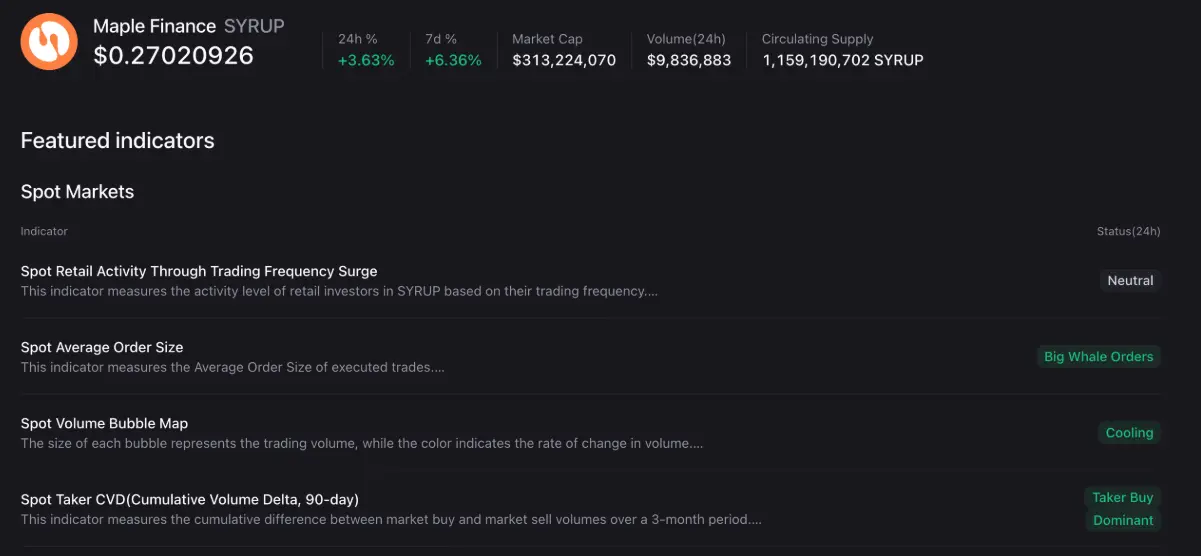 Spot Market Indicators for SYRUP | Source: CryptoQuant
Technical Outlook: Can SYRUP Recover in a Downtrend Channel?
Maple Finance currently trades just above the S1 Pivot level at $0.2497 USD — a short-term support buffer formed after a 31-day decline that saw SYRUP lose about 35% of its value. This movement clearly reflects a downward trajectory within a larger descending channel pattern, established by two parallel trendlines on the daily timeframe.
Conversely, a technical rebound could see SYRUP testing the 50-day Exponential Moving Average (EMA) at $0.3176 USD, before aiming for the 200-day EMA at $0.3666 USD — an area coinciding with the upper boundary of the price channel and serving as a key resistance level.
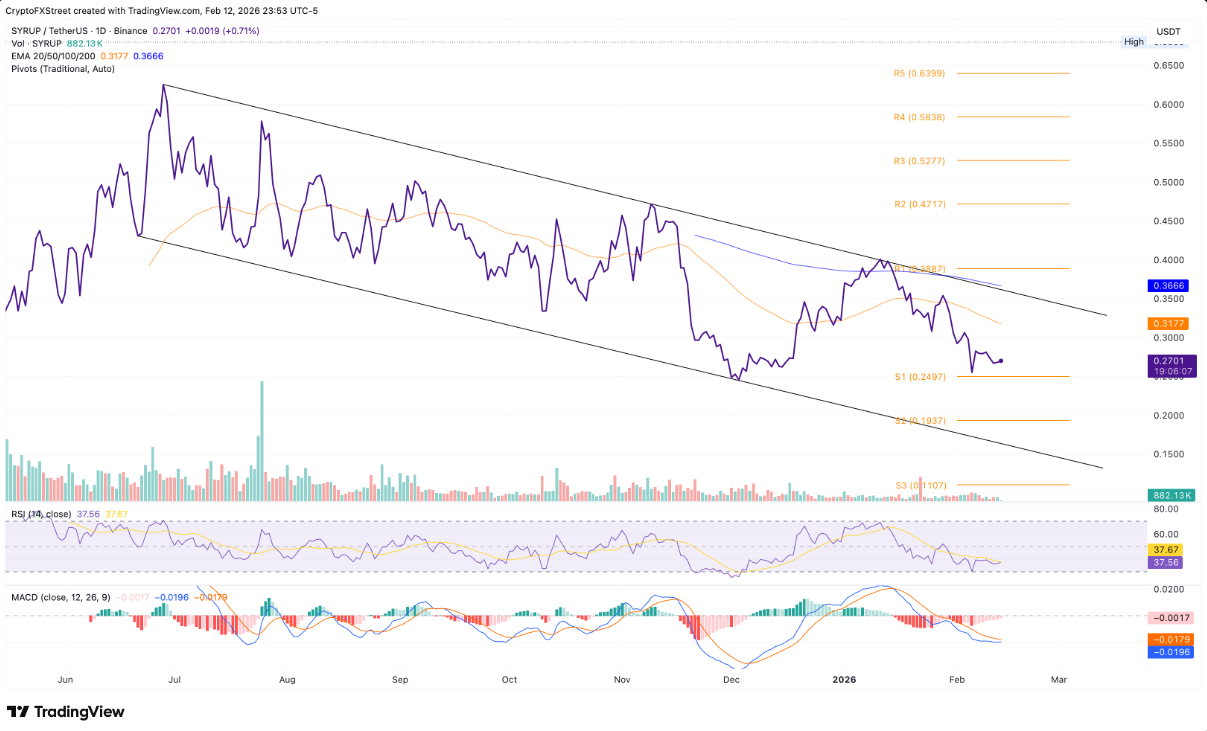 Daily SYRUP/USDT Chart | Source: TradingView
Technical signals suggest selling pressure is gradually weakening. The RSI currently hovers around 36, remaining above the oversold zone and sideways after a deep decline, implying that selling momentum is no longer overwhelming. Additionally, the MACD line is approaching the signal line as the histogram’s negative side narrows, increasing the likelihood of a bullish crossover — a potential short-term reversal indicator.
Daily SYRUP/USDT Chart | Source: TradingView
Technical signals suggest selling pressure is gradually weakening. The RSI currently hovers around 36, remaining above the oversold zone and sideways after a deep decline, implying that selling momentum is no longer overwhelming. Additionally, the MACD line is approaching the signal line as the histogram’s negative side narrows, increasing the likelihood of a bullish crossover — a potential short-term reversal indicator.
However, a negative scenario should still be considered. If SYRUP closes below the $0.2497 USD level, selling pressure could intensify, pushing the price down toward the S2 Pivot at $0.1937 USD.
Disclaimer: The information on this page may come from third parties and does not represent the views or opinions of Gate. The content displayed on this page is for reference only and does not constitute any financial, investment, or legal advice. Gate does not guarantee the accuracy or completeness of the information and shall not be liable for any losses arising from the use of this information. Virtual asset investments carry high risks and are subject to significant price volatility. You may lose all of your invested principal. Please fully understand the relevant risks and make prudent decisions based on your own financial situation and risk tolerance. For details, please refer to
Disclaimer.
Related Articles
‘Extreme Fear’ Is Back but Bitcoin’s Price Recovery Depends on it: Santiment
Bitcoin dipped to a four-week low on Friday at $65,500 after it was rejected at $72,000 a few days earlier, which pushed the overall market sentiment back to ‘extreme fear’ territory.
However, the analysts from Santiment believe this could be the precise push BTC needs to stage a notable
CryptoPotato22m ago
Bitcoin ETF records inflows again after October, as the price stabilizes
Bitcoin ETFs have seen a return of inflows after a period of stagnation, indicating renewed interest from institutional investors despite a significant price drop. The slight decrease in total assets under management reflects resilience and a potential for market recovery.
TapChiBitcoin25m ago
Bitcoin Is Repeating 1972 Gold Breakout Setup, Fueling Bullish Pump Speculations
Bitcoin is repeating 1972 gold breakout setup.
This pattern fuels bullish pump speculations across the crypto community.
One analyst says $1 million BTC ATH target is still a possibility.
The crypto community remains anxious as the price of Bitcoin (BTC), the pioneer crypto asset,
CryptoNewsLand44m ago
Bitcoin’s old peaks aren’t untouchable anymore, and the days of parabolic rallies could be over
Since its inception, bitcoin BTC$68,398.71 has been like a daredevil climber scaling new heights, rarely looking back at the ledges it left behind. Its price seldom retraced to previous bull-market peaks, even during long, grueling bear markets.
But that pattern seems to have changed, suggesting th
CoinDesk51m ago
Bitcoin Tapped $69K, Oil Prices Ended March With 60% Surge: Market Watch
Bitcoin jumped to a new multi-day peak of over $69,200 earlier today as the markets prepare for Trump’s highly anticipated speech on the war against Iran.
Most larger-cap alts are also in the green, with ETH climbing past $2,100 and XRP defending the $1.30 support. ZEC and HBAR have posted the
CryptoPotato1h ago
BTC’s trading price is 21% above the realized price, the lowest premium level in the past three years
Gate News, April 1, BTC’s current trading price is 21% higher than its realized price (the average purchase cost of all circulating BTC). Data shows that BTC’s realized price is $54,286, and the current premium level is the lowest in the past three years, with a premium performance close to the historical cycle’s bottom-range behavior.
GateNews1h ago
