Bitcoin Cash (BCH) is currently one of the few cryptocurrencies in the top 10 with a weekly price chart trending upward. Meanwhile, BNB was once considered a potential next candidate but has been under heavy pressure, experiencing a 54% decline over the past four months.
In contrast, BCH has maintained trading within a stable range for nearly 20 months. The price range fluctuates from $272 to $640, offering many attractive opportunities for swing traders.
According to a report from Coinphoton, long-term investors expect this range’s high to be broken and turned into support before considering participation in a stronger bullish trend. Although buyers attempted a breakout in early January, this effort was unsuccessful due to a market-wide sell-off that caused the price to reverse and correct.
However, currently, the Bitcoin Cash network appears to be maintaining a stable state. The significant increase in transaction volume along with active whale movements recently indicates strong on-chain liquidity circulation.
Short-term traders focus on the middle of the range to predict the next move
Since the second week of October, BCH price has touched below the support level in the middle of the $456 range three times on the weekly timeframe. However, no weekly close has fallen below this level, keeping the outlook positive.
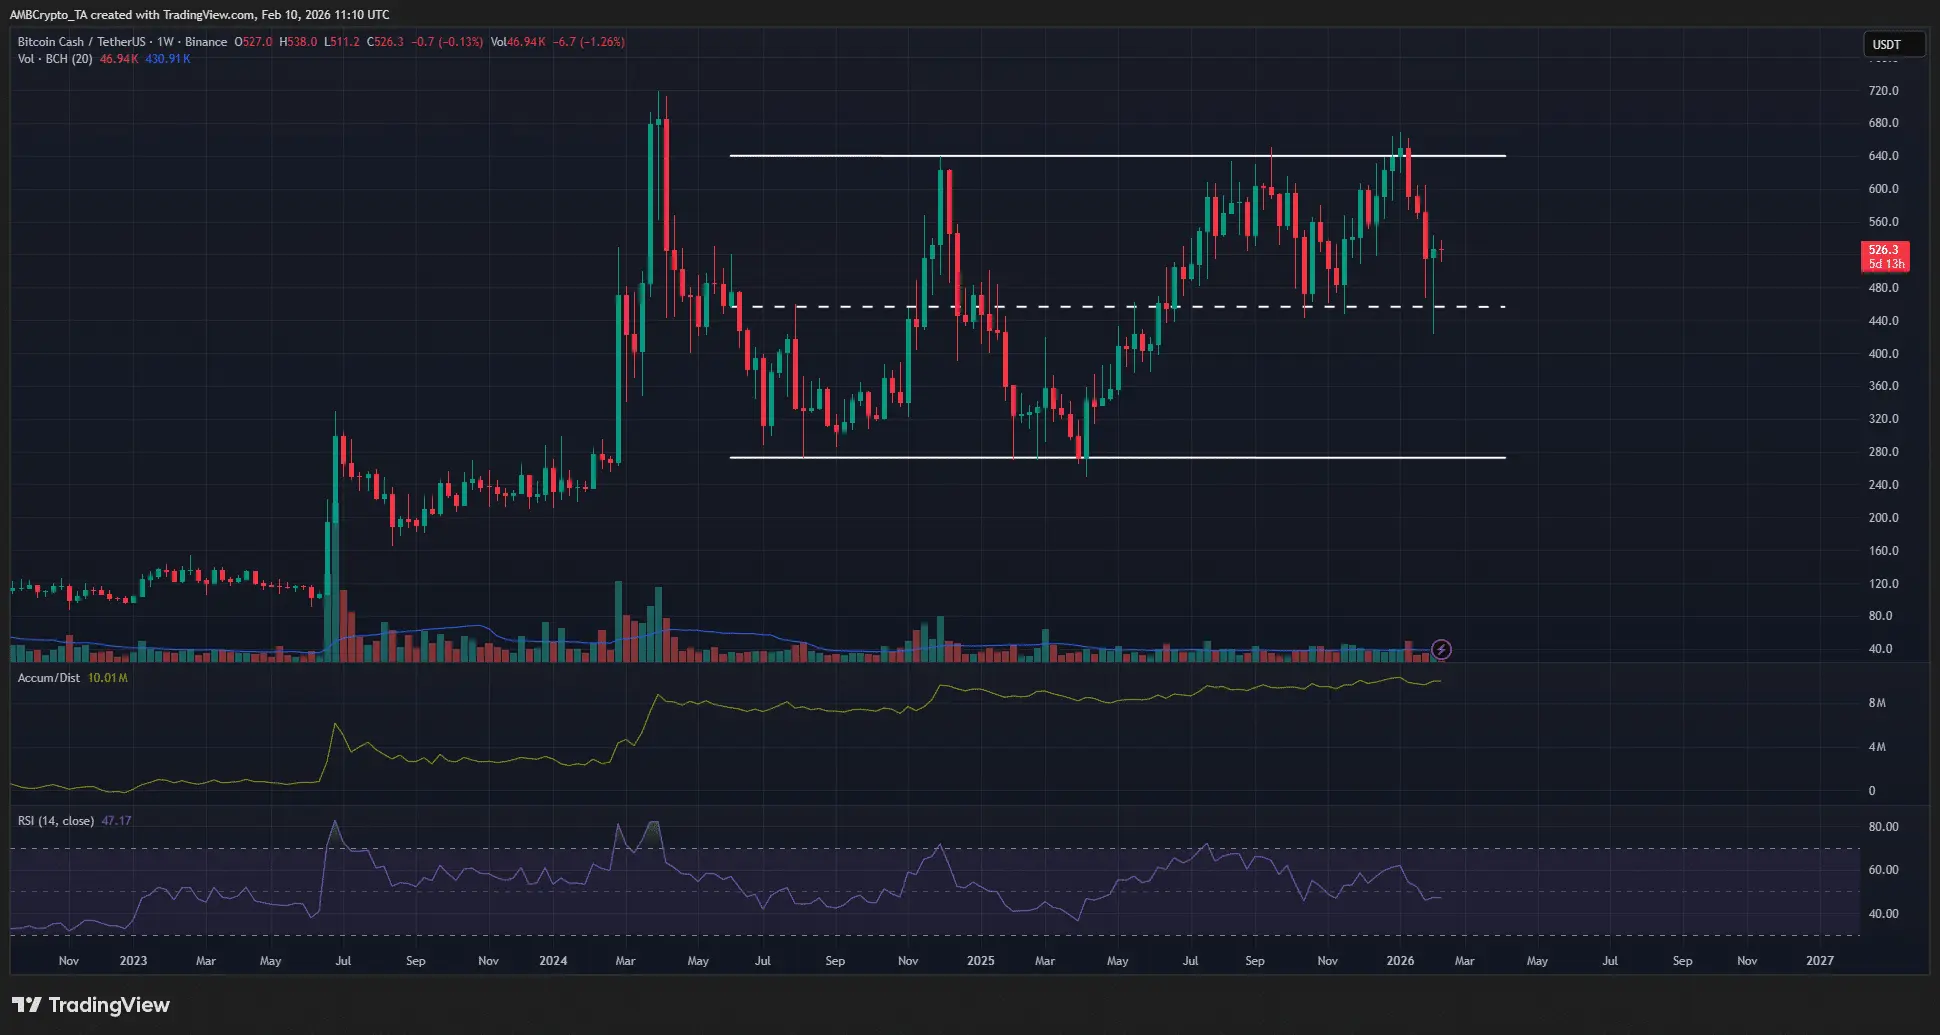 Source: TradingView The accumulation/distribution (A/D) indicator has maintained an upward trend since 2024, reflecting steady buying pressure. Additionally, the weekly RSI is currently at 47, indicating neutral momentum.
Combined with long-term price action, the $440–$460 zone is considered a low-risk, high-reward buying opportunity for investors.
Local supply zones may exert downward pressure
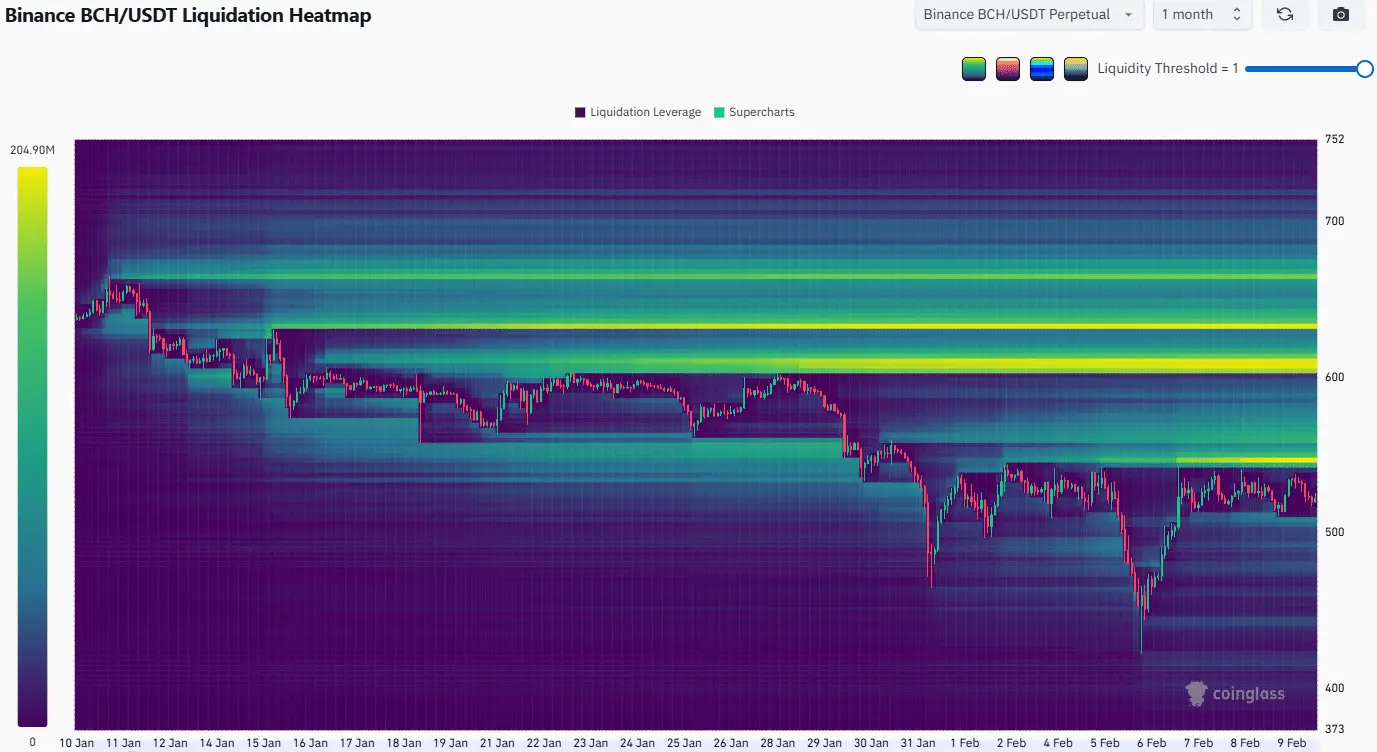
Liquidation heatmaps show that the $550 and $610 price levels are important nearby zones with significant potential to attract upward price movement before a reversal occurs. Notably, the supply zone at $550 has accumulated liquidity over the past 10 days.
 Source: CoinGlass Furthermore, the 4-hour chart indicates that BCH buyers have failed to break through the resistance at $540.
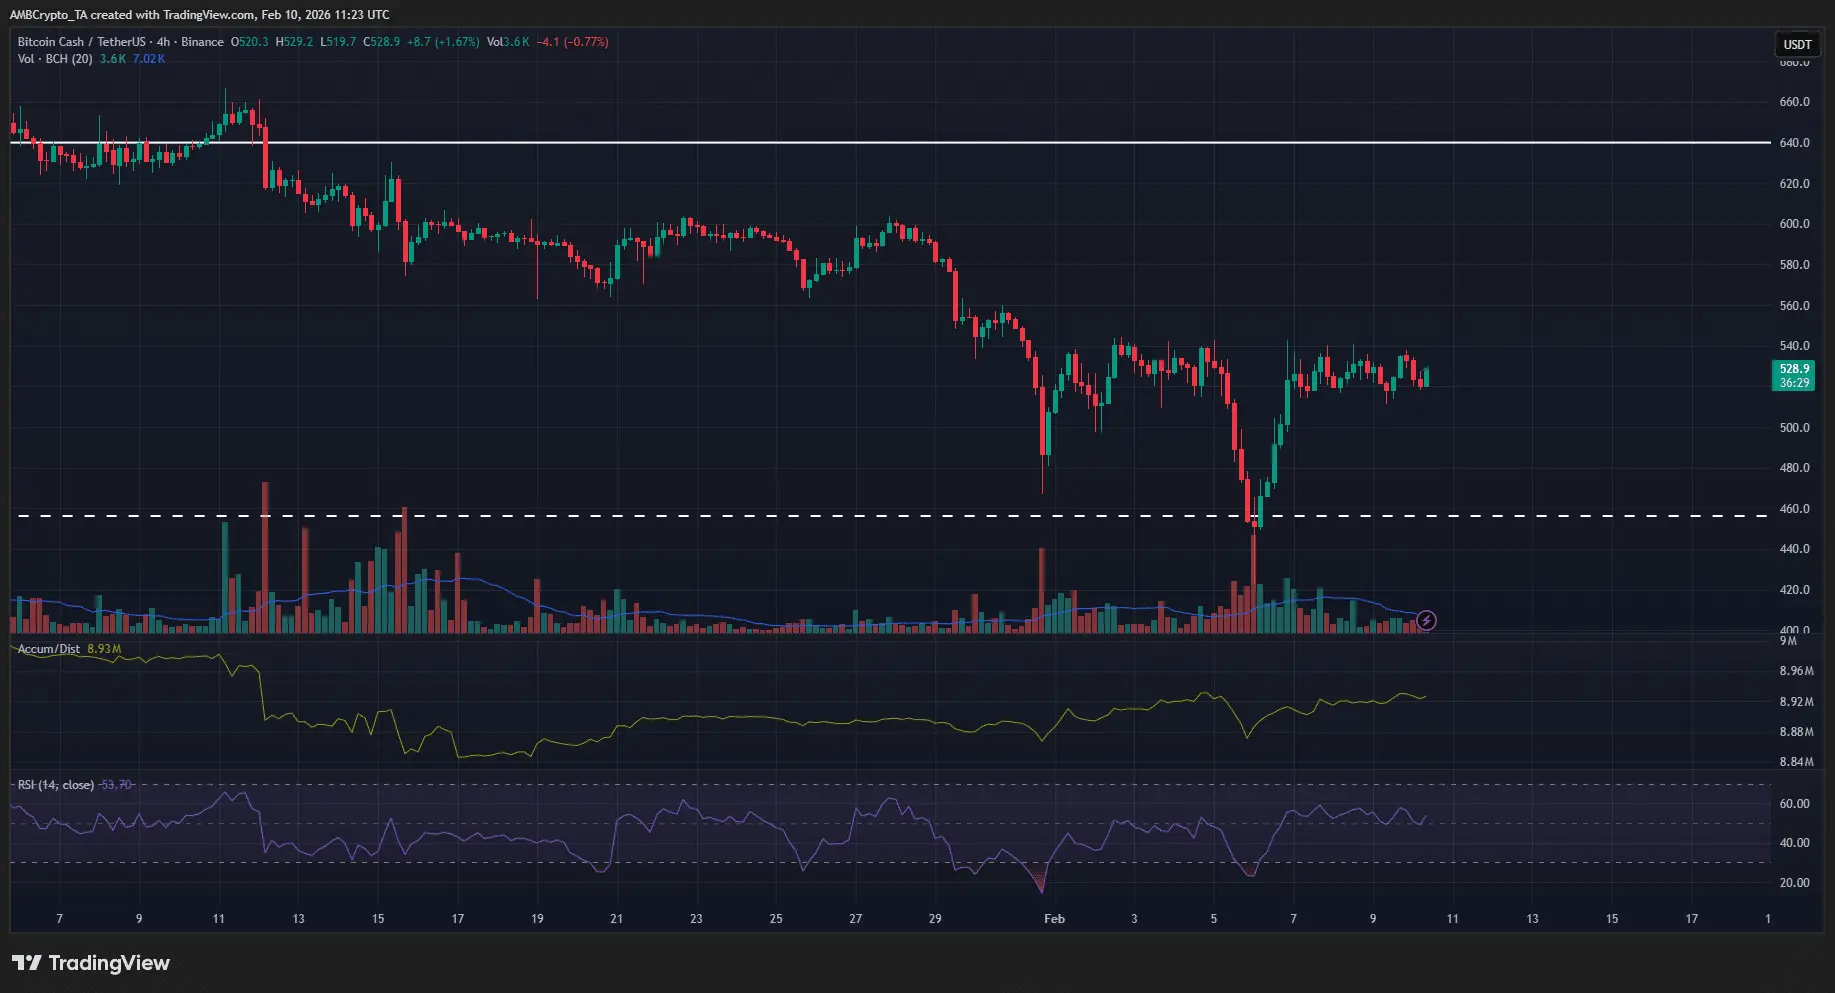 Source: TradingView Therefore, a possible scenario is that the price will be pushed higher in the short term to the $550–$560 zone before correcting downward to around $460. However, if BCH can break above $580, this scenario will be invalidated, opening the potential for a stronger rally.
Disclaimer: The information on this page may come from third parties and does not represent the views or opinions of Gate. The content displayed on this page is for reference only and does not constitute any financial, investment, or legal advice. Gate does not guarantee the accuracy or completeness of the information and shall not be liable for any losses arising from the use of this information. Virtual asset investments carry high risks and are subject to significant price volatility. You may lose all of your invested principal. Please fully understand the relevant risks and make prudent decisions based on your own financial situation and risk tolerance. For details, please refer to
Disclaimer.
Related Articles
Crypto Fear Index rises to 13, market "fear" sentiment slightly eases
BlockBeats News, March 27 — According to Alternative data, today’s cryptocurrency Fear and Greed Index is 13 (yesterday was 10), indicating a slight easing of market "fear" sentiment.
Note: The Fear and Greed Index threshold is 0-100, including indicators: volatility (25%), market trading volume (25%), social media buzz (15%), market surveys (15%), Bitcoin’s proportion in the overall market (10%), and Google trending searches analysis (10%).
BlockBeatNews8m ago
Peter Brandt: Bitcoin shows a sell signal
Renowned trader Peter Brandt posted a chart indicating that Bitcoin's price is forming an ascending wedge pattern, suggesting a possible decline. The current price is in the $65,000-$70,000 range, and Brandt previously accurately predicted a short-term rebound for Bitcoin.
BlockBeatNews9m ago
The current mainstream CEX and DEX funding rates indicate that the market bearish sentiment has weakened.
According to BlockBeats, Bitcoin prices have slightly declined, and the funding rates on major exchanges indicate a weakening of the bearish market sentiment. The funding rate is a mechanism that adjusts the difference between the contract price and the underlying asset price.
BlockBeatNews10m ago
Renowned trader Peter Brandt: BTC is forming an ascending wedge pattern, which may trigger a sell signal.
Gate News reports that on March 27, well-known trader Peter Brandt posted on social media early this morning stating that Bitcoin's current trend is forming a Rising Wedge pattern, which could trigger a sell signal. Peter Brandt successfully predicted the Bitcoin crash in 2018.
GateNews15m ago
Midnight (NIGHT) Lands a $335M Bank Deal – And Cardano Is Being Asked Serious Questions
Midnight hasn’t even launched, and yet, they just pulled off something that most blockchains dream about. Monument Bank is going to tokenize retail customer deposits. In the first phase alone, that’s $335 million worth of real-world assets moving onto Midnight.
That’s more than the value of al
CaptainAltcoin51m ago
WSJ: The likelihood of a successful ceasefire between the US and Iran remains low; the 15-point plan was rejected, and Iran refuses to relinquish nuclear weapons and missiles.
The article states that Iran has not proactively requested the U.S. to suspend its energy strikes, contradicting Trump's claims. The ceasefire negotiations are progressing poorly, with Iran responding strongly to the U.S. proposal at 3 p.m., refusing to discuss nuclear weapons and missile issues. The passage of oil tankers through the Strait of Hormuz is seen as a symbolic progress, but there has been no substantial breakthrough. This situation affects the performance of risk assets like Bitcoin, and the OECD warns that if the conflict continues, U.S. inflation could rise.
動區BlockTempo1h ago
