Pump.fun (PUMP) continues to face correction pressure, declining about 2% at the time of writing on Tuesday, extending the previous session’s 4% plunge. The token of this launchpad platform remains at risk of deeper decline, as 10 billion PUMP are scheduled to be unlocked today, increasing supply pressure amid waning retail investor interest. From a technical perspective, PUMP’s outlook continues to lean toward a negative scenario, with selling pressure clearly dominant and bearish momentum still prevailing in the market.
Monthly token unlocks and weak demand increase downside risk
Data from DeFiLlama indicates that approximately 10 billion PUMP tokens will be unlocked on Tuesday evening and distributed to the community fund and ecosystem. With a total value exceeding $20 million, this amount—especially the portion allocated to the community—could add to selling pressure, as investor sentiment has not yet recovered from last week’s sharp market sell-off.
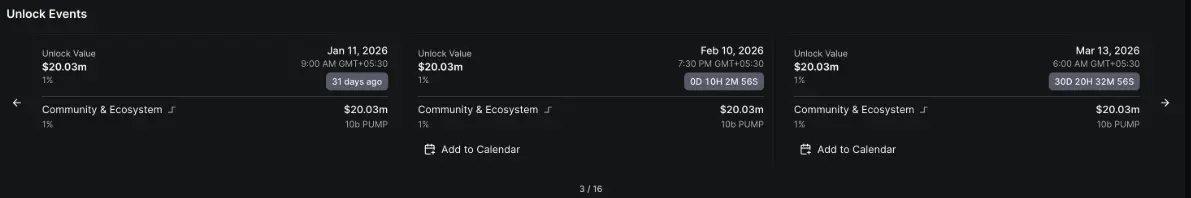 PUMP unlock data | Source: DeFiLlama Conversely, data from CoinGlass shows that the open interest (OI) of PUMP futures contracts has been steadily declining, dropping to $161.95 million on Tuesday. This trend reflects increasing caution and diminishing participation from retail investors.
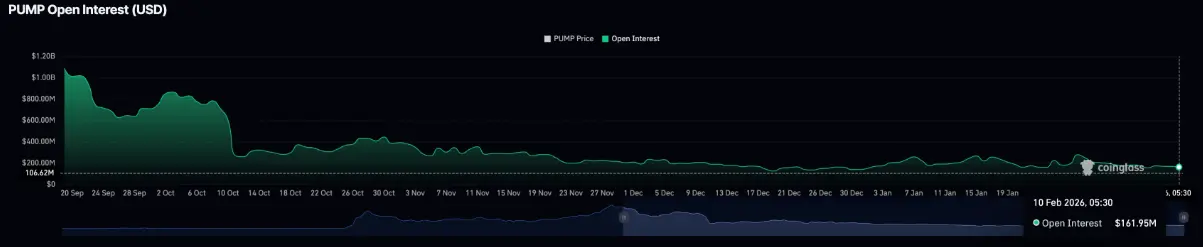 PUMP futures open interest (OI) | Source: CoinGlass
Technical analysis: Will PUMP continue to fall sharply?
PUMP broke below the key psychological level of $0.002000 after a 4% decline on Monday. The selling momentum shows no signs of stopping; as of this writing, the price continued to lose nearly 2% on Tuesday, marking the fourth consecutive day of decline since the peak on February 6 at $0.002201.
The current weakening trend is pushing PUMP close to the support zone at $0.001886—corresponding to the 4-hour candle low formed on February 5. If the price closes clearly below this level on the 4-hour chart, the downtrend is likely to extend, with the next target being the December 29 low around $0.001775.
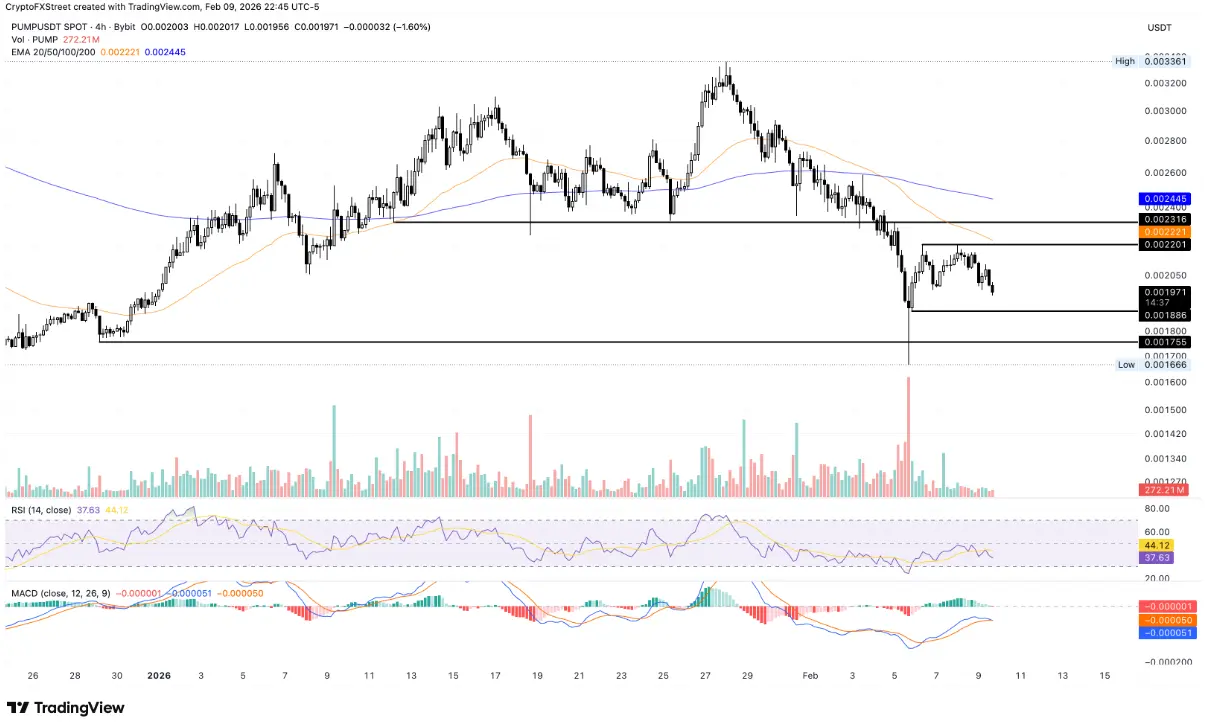 PUMP/USDT 4-hour chart | Source: TradingView
From a technical standpoint, momentum indicators on the 4-hour chart are leaning toward a negative scenario. The RSI has retreated to around 40 and turned downward from the neutral zone, indicating room for correction before entering oversold territory. Meanwhile, the MACD line is approaching the signal line, increasing the risk of a bearish crossover.
Conversely, if the bulls manage to quickly regain the $0.002000 level, the price could recover to test the 50-period EMA at $0.002213, near the short-term high on February 6 at $0.002201.
Disclaimer: The information on this page may come from third parties and does not represent the views or opinions of Gate. The content displayed on this page is for reference only and does not constitute any financial, investment, or legal advice. Gate does not guarantee the accuracy or completeness of the information and shall not be liable for any losses arising from the use of this information. Virtual asset investments carry high risks and are subject to significant price volatility. You may lose all of your invested principal. Please fully understand the relevant risks and make prudent decisions based on your own financial situation and risk tolerance. For details, please refer to
Disclaimer.
Related Articles
The Crypto Fear and Greed Index rose to 17 today, and the market remains in a state of extreme fear
Gate News message: On April 8, according to Alternative.me data, the crypto Fear and Greed Index rose to 17 today, up from 11 yesterday (April 7), but the market overall is still in a state of “extreme fear.”
GateNews18m ago
Bitcoin reclaims $72K after US, Iran agree to 2-week ceasefire
Bitcoin surged past $72,000 after a two-week ceasefire between the US and Iran was announced. Traders often react positively to eased geopolitical tensions, despite overall market fear.
Cointelegraph18m ago
BTC drops 1.03% in 15 minutes: tighter macro liquidity and derivatives synchronized to amplify sell-off pressure
From 23:30 to 23:45 (UTC) on 2026-04-07, the BTC price rapidly fell within 15 minutes, with a return of -1.03%. The price range was 71,905.7 to 72,760.5 USDT, and the amplitude was 1.17%. Market attention remained high; intraday volatility significantly increased. Trading volumes across major platforms briefly surged, indicating that selling pressure and risk-avoidance sentiment had permeated mainstream cryptocurrencies.
The main drivers of this deviation were the continued tightening of macro liquidity under the Fed’s hawkish signals and a concentrated adjustment in the BTC derivatives market. The Fed’s interest rate in March 2026
GateNews1h ago
Peter Schiff Challenges Michael Saylor as Bitcoin Debate Heats Up
Peter Schiff and Michael Saylor recently debated Bitcoin's performance, with Schiff arguing it underperformed gold and equities over five years, while Saylor highlighted shorter-term gains. Their dispute illustrates the complexity of data selection in assessing investment viability.
CryptoFrontNews1h ago
BTC 15-minute surge of 1.07%: On-chain activity spikes and ETF fund inflows synchronize to drive the move
2026-04-07 22:45 to 2026-04-07 23:00 (UTC), the BTC price recorded a +1.07% return. The price range was 70,733.5 to 71,518.9 USDT, with a 1.11% amplitude. Short-term volatility intensified, drawing strong market attention. On-chain data shows the number of active addresses rose to 38,971, up 5.2% from the previous hour. The total number of addresses added approximately 252,780 within an hour; network activity and new user growth increased significantly, becoming the incremental market momentum behind the unusual move. Spot trading volume reached 11
GateNews1h ago
ETH 15-minute increase of 0.64%: Short-term capital inflows and sentiment shifts drive price fluctuations
2026-04-07 22:00 to 22:15 (UTC), the ETH price ranged between 2145.02 and 2165.83 USDT, and the 15-minute candlestick return reached +0.64%, with a trading range (amplitude) of 0.97%. Market volatility increased and attention rose, indicating short-term activity driven by rapid capital flows.
The main driving force behind this unusual move is that, in the short term, some funds flowed into ETH. Investors are focusing on ETH mainnet assets, and buying interest increased, pushing spot prices higher. At the same time, DeFi and stablecoin-related trading remained active, boosting on-chain liquidity and helping to support a
GateNews2h ago
