
Key Takeaways
-
AAVE has dropped nearly 23% in 30 days, but price is now holding a major long-term support zone between $113–$129.
-
The weekly chart shows a potential double bottom pattern, signaling a possible trend reversal if support continues to hold.
-
A reclaim of the 100-week moving average near $137.8 could strengthen bullish momentum and open the path toward $378–$400 resistance.
The broader altcoin market has come under heavy selling pressure over the past few days, with sentiment deteriorating rapidly across major assets. Ethereum (ETH) has plunged more than 28%, setting the tone for the wider market. Unsurprisingly, Aave ($AAVE) hasn’t been spared, shedding nearly 23% over the past 30 days.
While short-term sentiment remains fragile, a closer look at AAVE’s weekly chart suggests price has now reached a technically important area — one that could serve as a foundation for a potential bounce if buyers continue to step in.
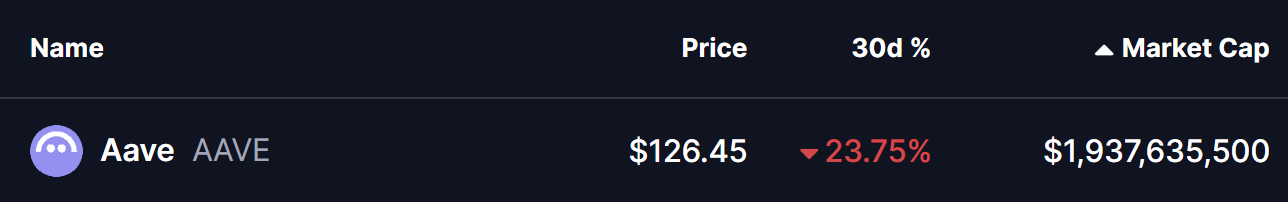
Source: Coinmarketcap
Double Bottom Pattern in Play?
On the weekly timeframe, AAVE appears to be forming a potential double bottom pattern, a classic bullish reversal structure that often develops near the end of prolonged downtrends.
The first bottom formed when AAVE dropped into the $113–$129 support zone, followed by a strong recovery attempt that pushed price toward the neckline resistance between $378 and $400. That rally ultimately faced rejection, but the latest sell-off has brought AAVE right back into the same support region.
What stands out this time is the buyer response. Price has once again stabilized within the $113–$129 zone, suggesting that bulls are actively defending this area and are not yet ready to give up control. The repeated defense of identical lows strengthens the case for this zone acting as a major accumulation region.
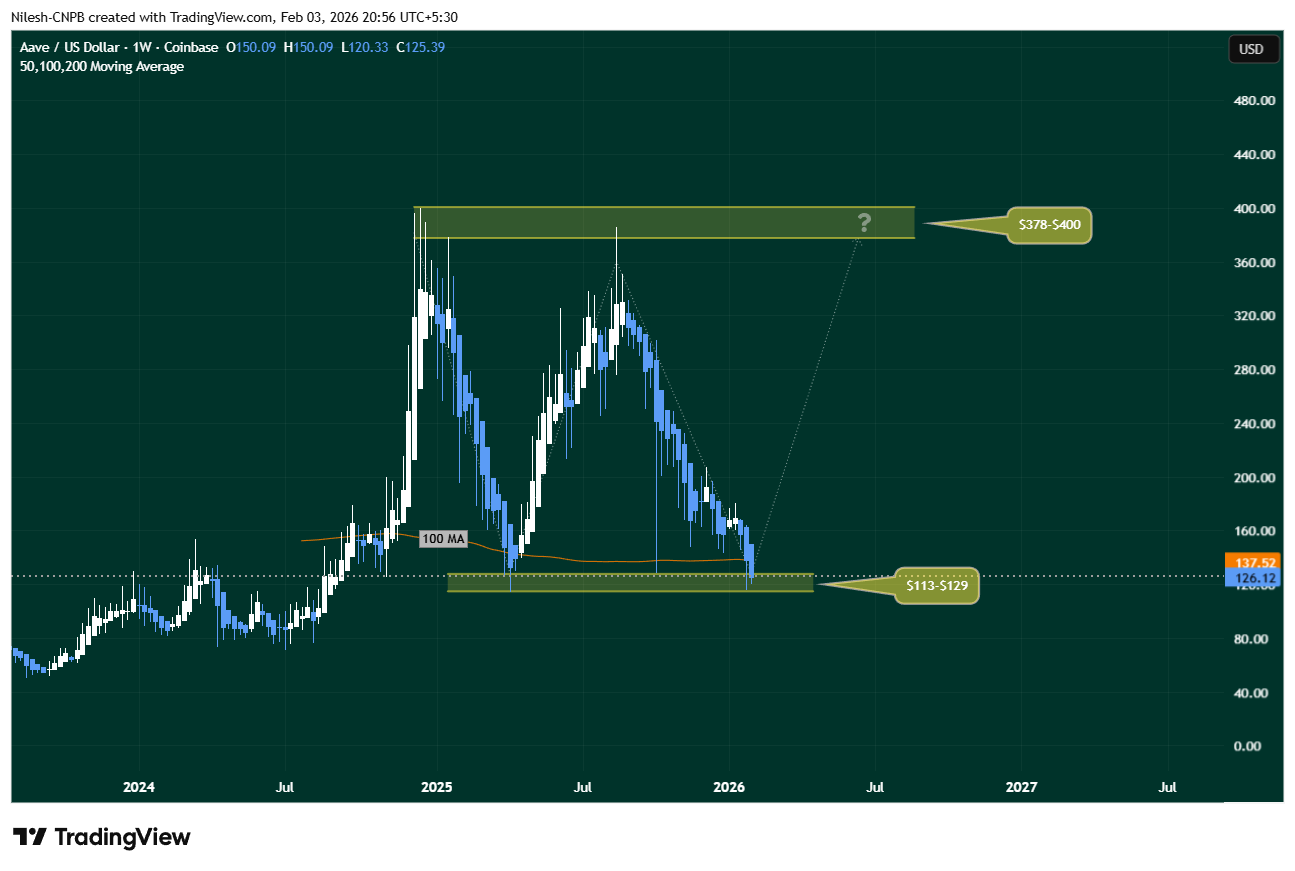
Aave ($AAVE) Weekly Chart/Coinsprobe (Source: Tradingview)
As long as AAVE continues to hold above this level, the broader double bottom structure remains technically valid.
What’s Next for AAVE?
For the bullish setup to gain traction, AAVE must hold the $113–$129 support zone and reclaim the 100-week moving average, currently sitting near $137.52. A sustained move above this level would signal improving momentum and mark an important shift in market structure.
If buyers manage to push price higher from here, the next major upside objective would be the neckline resistance at $378–$400. While that target may appear distant, a successful double bottom confirmation often leads to sharp recovery moves — especially if broader market conditions stabilize.
On the downside, the $113–$129 region remains the line in the sand. A decisive breakdown below this zone would invalidate the bullish setup and open the door to deeper downside risk.
Final Outlook
Despite recent weakness, AAVE’s technical structure remains constructive. The repeated defense of key support, the developing double bottom formation, and price hovering near the 100-week moving average suggest the token may be approaching a pivotal inflection point.
If accumulation continues and broader crypto sentiment improves, AAVE could be setting the stage for a meaningful recovery phase. Until then, all eyes remain on how price behaves around this critical support zone.
Disclaimer: The views and analysis presented in this article are for informational purposes only and reflect the author’s perspective, not financial advice. Technical patterns and indicators discussed are subject to market volatility and may or may not yield the anticipated results. Investors are advised to exercise caution, conduct independent research, and make decisions aligned with their individual risk tolerance.
About Author: Nilesh Hembade is the Founder and Lead Author of Coinsprobe, with over 5 years of experience in the cryptocurrency and blockchain industry. Since launching Coinsprobe in 2023, he has been providing daily, research-driven insights through in-depth market analysis, on-chain data, and technical research.
Disclaimer: The information on this page may come from third parties and does not represent the views or opinions of Gate. The content displayed on this page is for reference only and does not constitute any financial, investment, or legal advice. Gate does not guarantee the accuracy or completeness of the information and shall not be liable for any losses arising from the use of this information. Virtual asset investments carry high risks and are subject to significant price volatility. You may lose all of your invested principal. Please fully understand the relevant risks and make prudent decisions based on your own financial situation and risk tolerance. For details, please refer to
Disclaimer.
Related Articles
Solana Holds Key Support as Range Tightens Below $90
Key Insights
Solana trades near $80 support as price compresses within a tight range, reflecting reduced volatility and balanced market participation among traders.
Persistent lower highs and price below major moving averages confirm ongoing bearish structure, limiting recovery attempts
CryptoNewsLand39m ago
BTC 15-minute rise of 0.45%: driven by routine trading, with moderately resonating macro hedging sentiment
From 2026-04-07 15:15 to 15:30 (UTC), Bitcoin (BTC) recorded a +0.45% return. The price moved slightly upward within the USDT range of 67,886.0 to 68,199.5, with an amplitude of 0.46%. During this period, market attention increased somewhat, but overall volatility remained within the normal range, and no unusual market fluctuations appeared.
The main driving force behind this anomaly was routine trading activity in the spot market. On-chain data shows that the number of active addresses in the 15-minute window was about 66,000, slightly higher than the previous period. In the same period, spot trading volume increased by about 0.5 from the previous period over period
GateNews53m ago
Schwab says even a 1% crypto allocation can reshape portfolio risk
Charles Schwab's research highlights that cryptocurrency allocation in portfolios relies more on investors' risk tolerance than return forecasts. With high volatility, even small crypto allocations can significantly affect portfolio risk, though they remain speculative investments.
CoinDesk1h ago
BTC 15-minute drop of 0.51%: short-term capital outflow and macro volatility converging to trigger a pullback
Between 2026-04-07 14:00 and 2026-04-07 14:15 (UTC), the BTC price fluctuated within the range of 67801.3 - 68256.1 USDT. The candlestick chart recorded a -0.51% return, with an amplitude of 0.67%. Short-term volatility intensified, and market attention increased significantly. Overall liquidity was still within the normal range, but showed marginal changes.
The main drivers of this unusual move are the combined effect of short-term capital outflows and the simultaneous rise in net inflows to exchanges. Short-term holders take profit or cut losses at market volatility nodes, pushing prices lower. Spot
GateNews2h ago
'A whole civilization will die': Crypto markets under pressure as Trump ups rhetoric towards Iran
Bitcoin has fallen to around $68,000 after hitting over $70,000, coinciding with Trump's Iran deadline. U.S. stock futures also declined, while oil prices rose. Vance's comments tempered market reactions, stating military goals in Iran were met.
CoinDesk2h ago
Analyst Says Five Years of Nothing for Ethereum and Altcoin Will Finally End Soon
Analyst says five years of nothing for Ethereum and altcoins will end soon.
This means the altseason peak phase is nearing.
How far can the price of ETH pump this year?
Expectations for altseason to play out this year remain strong despite the many calls for the bear market to have
CryptoNewsLand4h ago
