
Key Takeaways
-
Hyperliquid’s HIP-3 markets recorded a new all-time high daily volume of $4.83B
-
Open interest surged to a record $1.05B, up sharply from $260M last month
-
$HYPE has outperformed the broader crypto market, rising while ETH fell 24% YTD
-
The daily chart shows a Bearish Shark harmonic pattern, allowing short-term upside
-
A move toward $38.72 remains possible if momentum holds above the 50-day MA
HYPE, the native token of **Hyperliquid **— one of the fastest-growing decentralized perpetual trading platforms — has continued to show relative strength despite a broader crypto market downturn. While major assets like Ethereum (ETH) have suffered a sharp 24% decline year-to-date, HYPE has managed to stay bullish, posting over 21% gains during the same period.
This divergence has naturally caught traders’ attention. But beyond short-term price action, a deeper look into on-chain growth metrics and technical structure suggests that HYPE’s momentum may be driven by strong underlying fundamentals rather than pure speculation.
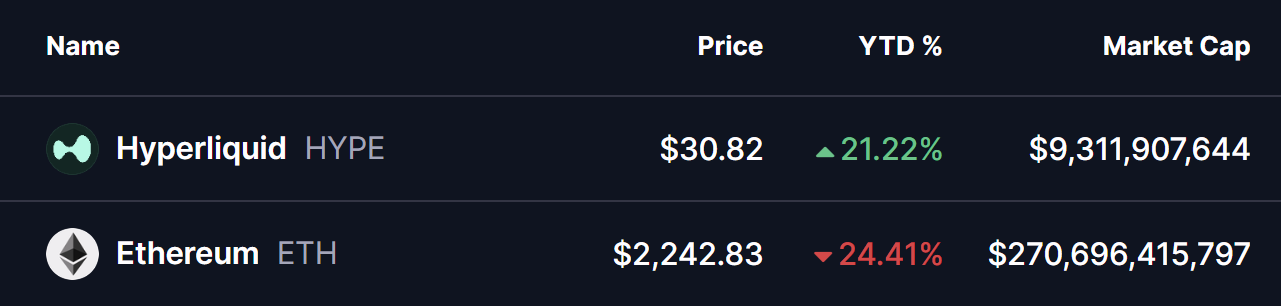
Source: Coinmarketcap
Hyperliquid’s HIP-3 Markets Hit Record Activity
According to the latest data from Flowscan, Hyperliquid’s HIP-3 protocol — launched last fall to enable permissionless on-chain markets for assets like gold, silver, and other commodities — has entered a phase of explosive growth.
Over the past week, daily trading volume across HIP-3 markets surged to approximately $4.83 billion, marking a new all-time high. At the same time, open interest (OI) climbed to a record $1.05 billion, fueled largely by rising demand for on-chain commodities exposure.
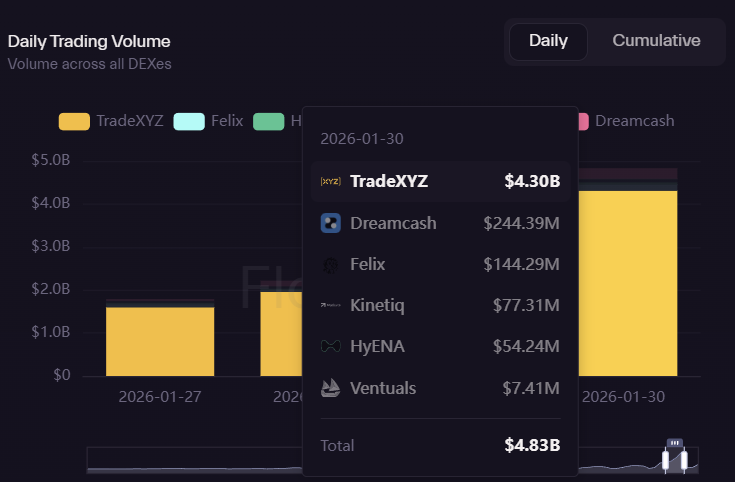
Source: Flowscan
What makes this growth particularly notable is its speed. Just a month ago, HIP-3 open interest hovered near $260 million. Since then, OI has consistently printed new weekly highs, signaling a rapid influx of capital and increasing trader participation within the Hyperliquid ecosystem.
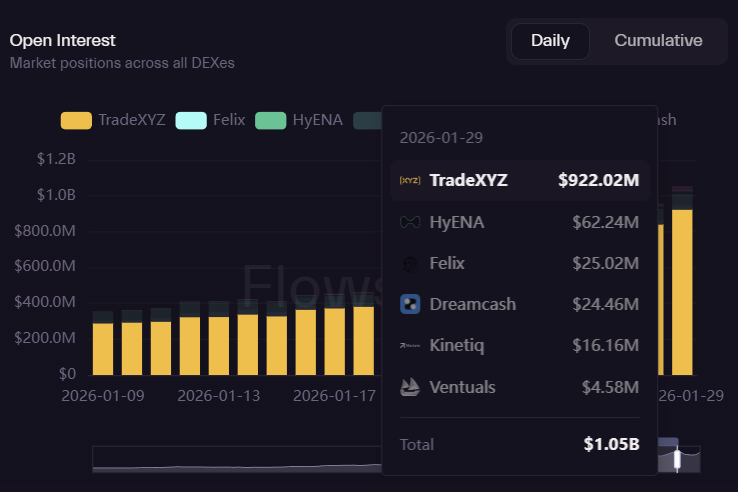
Source: Flowscan
This surge in volume and open interest reflects growing confidence in Hyperliquid’s infrastructure and execution — a dynamic that historically acts as a strong tailwind for the platform’s native token.
$HYPE Technical Structure Signals Room for Upside
From a technical standpoint, HYPE’s daily chart is forming a Bearish Shark harmonic pattern. While the name sounds ominous, this structure often appears during corrective phases and can still allow for short-term bullish continuation before a larger trend decision unfolds.
After completing the O–X–A–B leg, HYPE successfully reclaimed its 50-day moving average, a key signal that short-term momentum has shifted back in favor of buyers. Since then, price has been consolidating near the $30 region, suggesting accumulation rather than distribution.
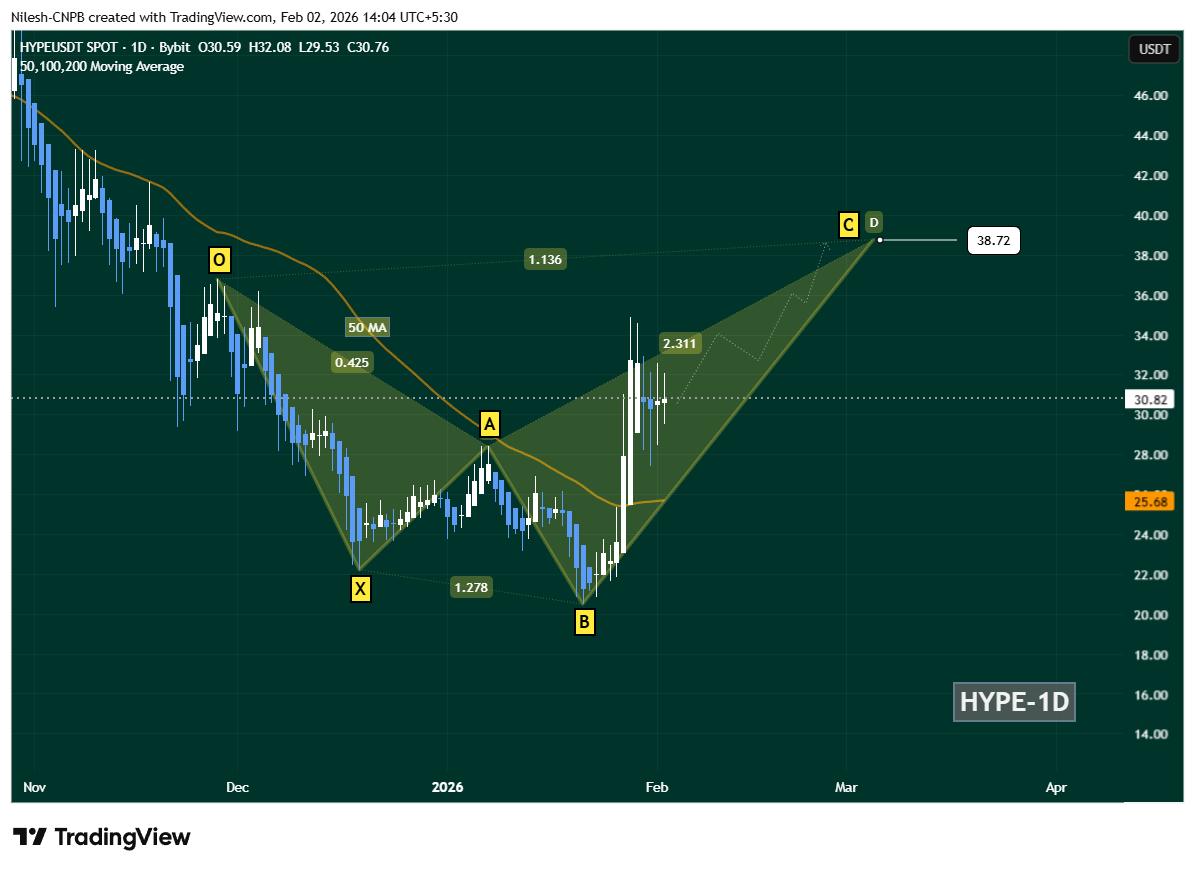
Hyperliquid (HYPE) Daily Chart/Coinsprobe (Source: Tradingview)
If current momentum holds, HYPE could continue its advance toward the C-point of the Shark pattern near $38.72. This level aligns closely with the 1.13 Fibonacci extension, a common target zone during harmonic pattern development and a logical area for the next technical reaction.
Market Outlook
With HIP-3 markets printing record volumes and open interest expanding at a rapid pace, Hyperliquid’s ecosystem growth appears firmly intact. If on-chain activity continues to scale alongside favorable technical conditions, HYPE may remain one of the stronger relative performers in the current market environment.
For now, traders will be watching whether HYPE can maintain support above the 50-day moving average and build enough momentum to challenge the $38–$40 resistance zone in the coming sessions.
Disclaimer: The views and analysis presented in this article are for informational purposes only and reflect the author’s perspective, not financial advice. Technical patterns and indicators discussed are subject to market volatility and may or may not yield the anticipated results. Investors are advised to exercise caution, conduct independent research, and make decisions aligned with their individual risk tolerance.
About Author: Nilesh Hembade is the Founder and Lead Author of Coinsprobe, with over 5 years of experience in the cryptocurrency and blockchain industry. Since launching Coinsprobe in 2023, he has been providing daily, research-driven insights through in-depth market analysis, on-chain data, and technical research.
Disclaimer: The information on this page may come from third parties and does not represent the views or opinions of Gate. The content displayed on this page is for reference only and does not constitute any financial, investment, or legal advice. Gate does not guarantee the accuracy or completeness of the information and shall not be liable for any losses arising from the use of this information. Virtual asset investments carry high risks and are subject to significant price volatility. You may lose all of your invested principal. Please fully understand the relevant risks and make prudent decisions based on your own financial situation and risk tolerance. For details, please refer to
Disclaimer.
Related Articles
Bitcoin Sits at a Crucial Support Level, Analyst Expects Break Above $79,000 or Below $64,000
Bitcoin sits at a crucial support level, big move could play out soon.
Analyst expects break above $79,000 for bullish reaction.
A bearish reaction and a drop below $64,000 could also play out.
This week was an exciting one for the
CryptoNewsLand10m ago
Solana Recovery Gains Pace While Derivatives Data Shows Split Sentiment
Key Insights
Solana records four consecutive days of gains as funding rates rise, signaling stronger retail interest while overall market conviction remains divided across participants.
Declining futures Open interest alongside rising funding rates highlights reduced trader exposure,
CryptoNewsLand1h ago
ATOM Eyes 15% Gain: Technical Indicators Point to Possible Upswing
ATOM broke a long bearish trend with a 5.25% price increase.
Price must close above $1.77 to confirm a potential 15% rally.
Top holders and rising Open Interest indicate growing bullish sentiment among traders.
Cosmos — ATOM, has started showing signs of breaking free from a long bearish
CryptoNewsLand1h ago
Bitcoin’s implied volatility drops to an intra-year low, and the market is reacting mildly to Friday’s CPI data
April 9, U.S. March CPI data will be released on April 11. The market expects the year-over-year rate to rise from 2.4% to 3.4%. The Bitcoin market has responded calmly, with the options market’s volatility range only at 2.5%. Attention has been drawn by the rise in gasoline prices. Analysts believe that CPI data coming in either too soft or too hot will have different impacts on the crypto market.
GateNews2h ago
XRP Stabilizes Near Key Levels Amid Fed Pressure and Rule Shift
Key Insights
XRP stabilized near $1.31 as macroeconomic pressures and declining liquidity combined to limit recovery momentum and increase short-term volatility risks significantly.
Proposed stablecoin regulations favor utility models, positioning RLUSD for growth while reducing incentives t
CryptoNewsLand2h ago
XRP Today’s News: Institutional funds return, circulating inflow of 120 million exceeds Bitcoin
This week, XRP recorded a $119.6 million capital inflow, setting the highest mark since 2025 and becoming a major beneficiary in the crypto market. This round of funds returning was mainly driven by greater clarity in regulatory policy and XRP’s real-world use in cross-border payment infrastructure. Technically, it shows an initial recovery, but overall it is still in a downward channel. The support and resistance levels are $1.31 and $1.40, respectively; if it breaks through, it is expected to reach $1.50.
MarketWhisper5h ago
