
Key Takeaways
-
SAND price is showing early signs of stabilization after recent downside pressure.
-
Buyers appear to be defending a key support zone, hinting at a potential short-term rebound.
-
A breakout above nearby resistance could open the door for a stronger recovery move.
Gaming-focused crypto tokens are back in the spotlight after Axie Infinity (AXS) posted a sharp rally of over 16% in a single day and more than 246% over the past month, reigniting optimism around the gaming narrative. Riding this renewed momentum, Sandbox (SAND) has also stepped into focus, climbing nearly 45% as overall market sentiment turns constructive.
Beyond the recent price bounce, the technical structure on the chart is starting to tell a bigger story, hinting that SAND may be setting up for a bullish continuation move.
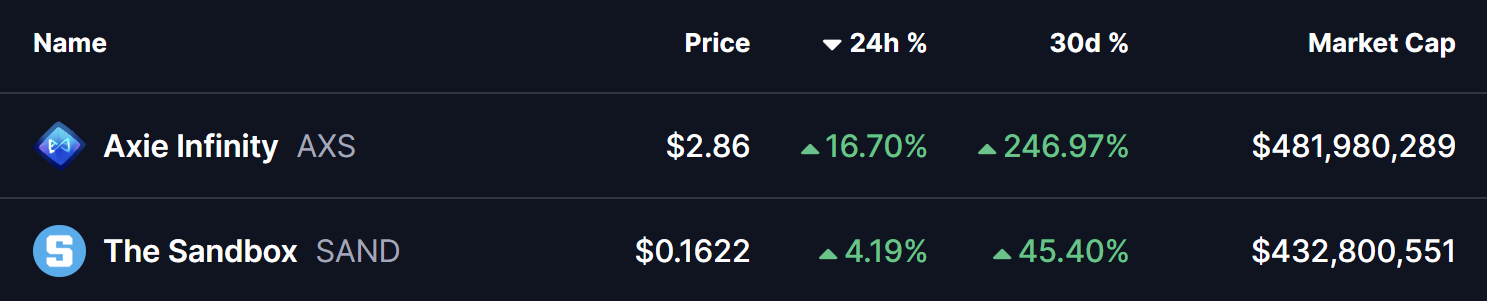
Source: Coinmarketcap
Descending Broadening Wedge Pattern in Play
On the daily timeframe, SAND is trading within a descending broadening wedge — a bullish reversal pattern that often develops during corrective phases before a trend shift. This structure reflects increasing volatility, with price gradually compressing while buyers quietly regain control.
During the latest pullback, SAND successfully retested the lower boundary of the wedge near the $0.11 zone, an area that has repeatedly acted as strong demand. Buyers stepped in aggressively at this level, triggering a rebound that pushed price toward $0.1711, placing SAND right near the wedge’s upper resistance trendline.
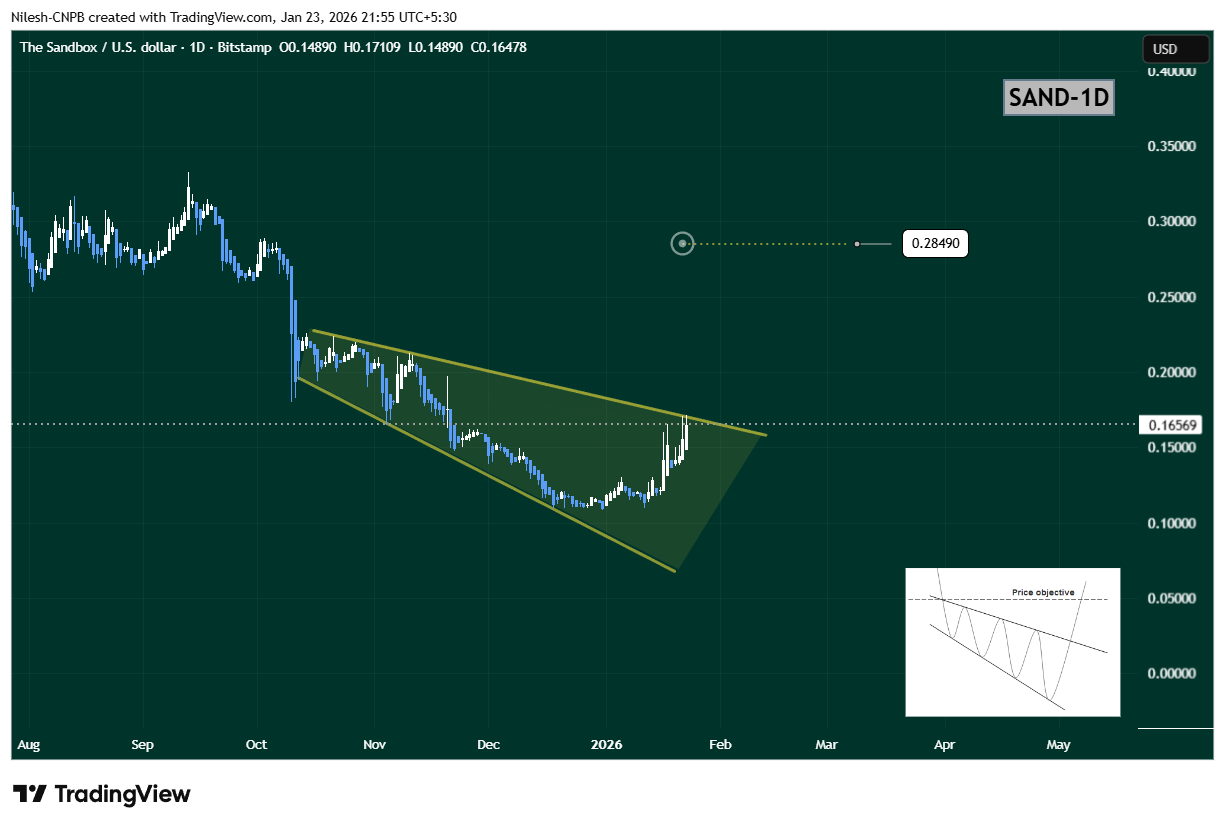
Sandbox (SAND) Daily Chart/Coinsprobe (Source: Tradingview)
The steady rise toward this upper boundary suggests growing bullish momentum and increasing breakout pressure.
What’s Next for SAND?
If buyers manage to push SAND above the upper wedge resistance near $0.1711, it would confirm a bullish breakout from the pattern. In that scenario, the chart opens the door for a move toward the $0.2849 target, which aligns with the measured move of the wedge and represents roughly 73% upside from current levels.
However, if price faces rejection at resistance, SAND could continue consolidating within the wedge structure. In that case, the $0.13–$0.14 region will act as an important short-term support zone to watch.
Bottom Line
SAND’s overall technical structure remains constructive. With a bullish descending broadening wedge in play, buyers defending key support, and gaming tokens gaining renewed attention, Sandbox appears to be positioning for a potential breakout. A confirmed move above resistance could mark the beginning of a stronger upside phase in the sessions ahead.
Disclaimer: The views and analysis presented in this article are for informational purposes only and reflect the author’s perspective, not financial advice. Technical patterns and indicators discussed are subject to market volatility and may or may not yield the anticipated results. Investors are advised to exercise caution, conduct independent research, and make decisions aligned with their individual risk tolerance.
About Author: Nilesh Hembade is the Founder and Lead Author of Coinsprobe, with over 5 years of experience in the cryptocurrency and blockchain industry. Since launching Coinsprobe in 2023, he has been providing daily, research-driven insights through in-depth market analysis, on-chain data, and technical research.
Disclaimer: The information on this page may come from third parties and does not represent the views or opinions of Gate. The content displayed on this page is for reference only and does not constitute any financial, investment, or legal advice. Gate does not guarantee the accuracy or completeness of the information and shall not be liable for any losses arising from the use of this information. Virtual asset investments carry high risks and are subject to significant price volatility. You may lose all of your invested principal. Please fully understand the relevant risks and make prudent decisions based on your own financial situation and risk tolerance. For details, please refer to
Disclaimer.
Related Articles
XRP Faces Selling Pressure While Key Support Near $1.28 Holds
Key Insights:
XRP continues forming lower highs and lows, while price remains below major moving averages, reinforcing a sustained bearish structure across timeframes.
Open interest spikes during volatility signaled speculative trading, yet declining levels now reflect reduced risk
CryptoNewsLand1m ago
Cardano Price Near $0.245 Level as Market Momentum Weakens
Cardano's price is stabilizing around the $0.245 support level amid market consolidation and declining momentum. The inability to break resistance at $0.268 raises concerns about upward strength. Meanwhile, development of the new node version 10.7.0 is in testing, promising enhancements for the ecosystem.
CryptoNewsLand1m ago
Dogecoin Holds Near $0.09 as April Pattern Shapes Outlook
Key Insights
Dogecoin maintains stability above the $0.09 support, with buyers defending the level despite consistent selling pressure that limits strong upward momentum in early April trading sessions.
April performance remains historically mixed, with past rallies and declines shaping
CryptoNewsLand5m ago
Here’s why bitcoin’s drop below $68,000 raises the risk of a crash under $60,000
President Donald Trump's renewed aggressive posturing toward Iran has pushed bitcoin lower by roughly 2% over the past 24 hours to $67,000. While this price action is consistent with routine volatility, beneath the surface, market structure looks fragile.
This is mainly due to flows in the
CoinDesk35m ago
PEPE Signals Range-Bound Move as Momentum Weakens
PEPE's trading remains cautious with neutral RSI and weak MACD, indicating limited momentum and ongoing selling pressure. Oversold stochastic hints at possible short-term rebounds, but traders await confirmation before entering positions amid mixed signals.
CryptoNewsLand46m ago
SHIB Price Rises on Golden Cross and Growing Market Activity
Key Insights
The Shiba Inu price rose about five percent as an hourly golden cross and higher volume signaled renewed trader participation and short-term momentum strength.
Exchange outflows and rising liquidity suggest accumulation behavior among holders while reinforcing price stability
CryptoNewsLand51m ago
