
Key Takeaways
-
Algorand (ALGO) is consolidating after a 13% decline over the past 60 days, while showing stabilization in the last month.
-
The daily chart reveals a repeating bullish fractal, similar to the setup that triggered ALGO’s 300% rally in November 2024.
-
Price is holding inside a long-term accumulation zone between $0.11 and $0.1530.
-
The 200-day moving average near $0.1912 is acting as key resistance and breakout confirmation level.
-
A successful reclaim of the 200 MA could open the path toward $0.60 and the ascending resistance trendline, while a drop below $0.11 would invalidate the bullish setup.
ALGO, the native token of Algorand’s Layer-1 blockchain, has shown steady but muted momentum over the past 30 days, helping slow down its broader correction. Despite this stabilization, ALGO remains down more than 13% over the last 60 days, keeping sentiment cautious across the market.
That said, when looking beyond short-term price noise, the daily chart is beginning to tell a familiar story. The current structure closely resembles a bullish fractal that, in the past, preceded a powerful breakout rally—raising an important question for traders: is this just consolidation, or a quiet accumulation phase before the next move?
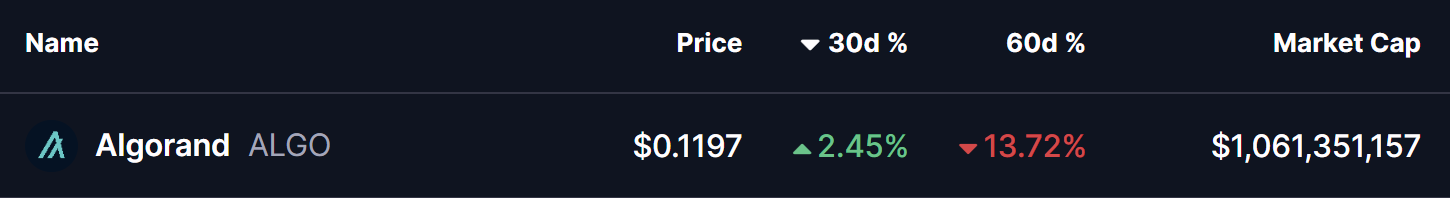
Source: Coinmarketcap
Fractal Setup Hints at a Bullish Reversal
On the daily timeframe, ALGO is displaying early signs of a repeating bullish structure, built around three key technical elements:
-
A rejection from the long-term ascending resistance trendline
-
A prolonged accumulation zone at major historical support
-
A potential reclaim of the 200-day moving average
The current corrective phase began in December 2024, when ALGO was rejected near the ascending resistance trendline around $0.60. That rejection triggered a deep pullback of more than 80%, eventually driving price back into the long-term demand zone between $0.11 and $0.1530—a region that has repeatedly acted as an accumulation area on the chart.
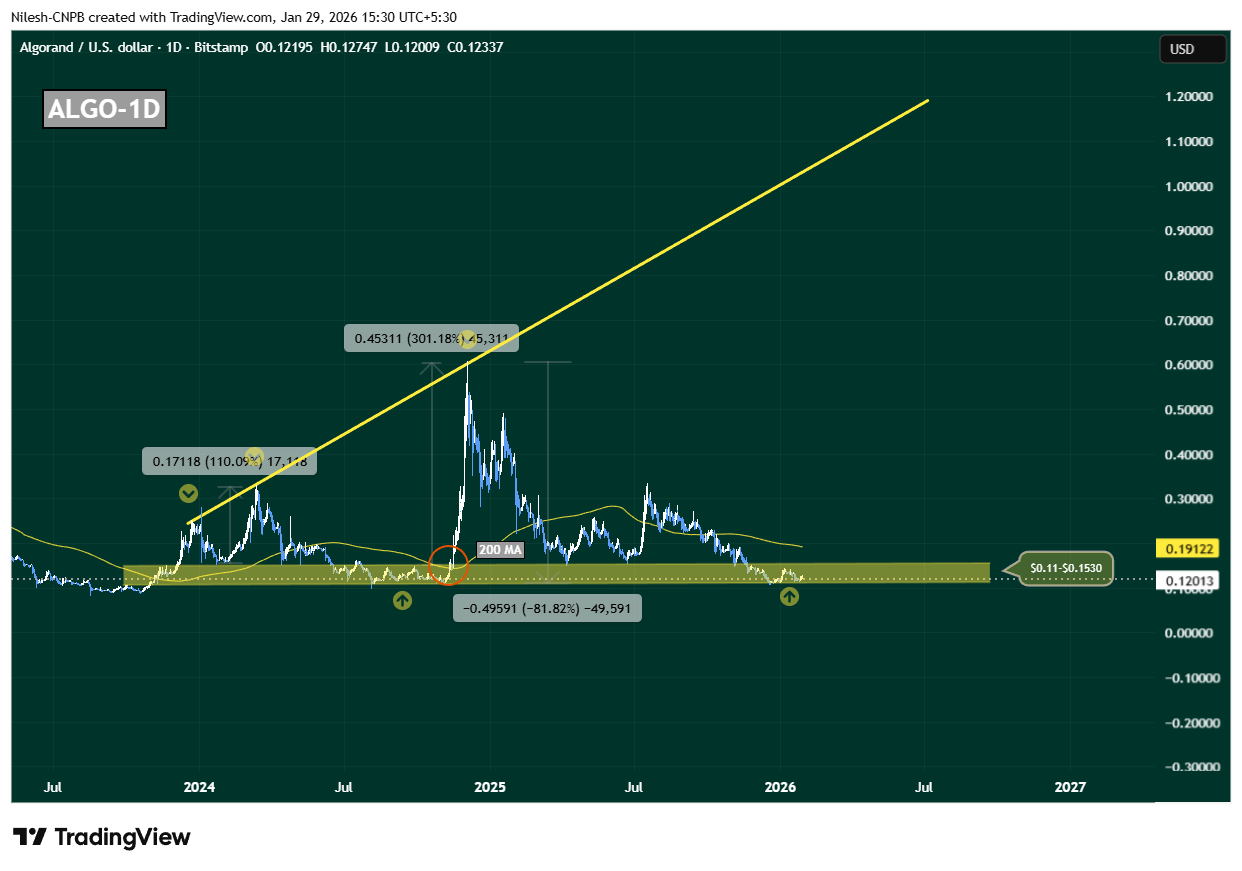
Algorand (ALGO) Daily Chart/Coinsprobe (Source: Tradingview)
This zone is not just technically important; it has also served as a launchpad during previous cycles, where downside momentum stalled and long-term buyers quietly stepped in.
History Rhymes on the ALGO Chart
What makes this setup particularly compelling is how closely it mirrors November 2024’s breakout structure. Back then, ALGO spent extended time consolidating near the same support band before reclaiming the 200-day moving average. Once that level flipped into support, price accelerated sharply—resulting in a 300% rally toward the ascending resistance trendline.
Today, ALGO is once again compressing inside this accumulation range, while the 200-day moving average sits overhead near $0.1912, acting as dynamic resistance. This alignment suggests the market may be approaching another inflection point.
What’s Next for ALGO?
At present, ALGO is hovering near $0.12, firmly inside its long-term accumulation zone. As long as price holds above this region, the broader bullish fractal remains intact.
A clean and sustained reclaim of the 200-day moving average around $0.1912 would be a critical confirmation signal. If bulls manage to flip this level into support, it would closely replicate previous breakout conditions and could trigger a sharp upside expansion. In that scenario, $0.60 becomes a realistic medium-term target, with further upside possible toward the ascending resistance trendline if momentum builds.
However, the structure is not without risk. A decisive breakdown below $0.11 would weaken the accumulation thesis, signal loss of long-term support, and open the door for deeper downside.
For now, ALGO sits at a make-or-break zone. The chart suggests patience is key—but if history repeats, this quiet phase may not last much longer.
Disclaimer: The views and analysis presented in this article are for informational purposes only and reflect the author’s perspective, not financial advice. Technical patterns and indicators discussed are subject to market volatility and may or may not yield the anticipated results. Investors are advised to exercise caution, conduct independent research, and make decisions aligned with their individual risk tolerance.
About Author: Nilesh Hembade is the Founder and Lead Author of Coinsprobe, with over 5 years of experience in the cryptocurrency and blockchain industry. Since launching Coinsprobe in 2023, he has been providing daily, research-driven insights through in-depth market analysis, on-chain data, and technical research.
Disclaimer: The information on this page may come from third parties and does not represent the views or opinions of Gate. The content displayed on this page is for reference only and does not constitute any financial, investment, or legal advice. Gate does not guarantee the accuracy or completeness of the information and shall not be liable for any losses arising from the use of this information. Virtual asset investments carry high risks and are subject to significant price volatility. You may lose all of your invested principal. Please fully understand the relevant risks and make prudent decisions based on your own financial situation and risk tolerance. For details, please refer to
Disclaimer.
Related Articles
The crypto market is broadly down; only the RWA sector is up slightly, at 0.42%.
On April 7, the crypto market fell broadly, with only the RWA sector up slightly by 0.42%. Major coins Bitcoin and Ethereum declined by 0.34% and 0.43%, respectively. Other sectors generally contracted, but some projects such as Creditcoin and Centrifuge rose against the trend.
GateNews50m ago
Tom Lee has released a post-war asset ranking, with Ethereum outperforming the broader market to win second place.
Tom Lee said on CNBC that since the start of geopolitical conflicts, Ethereum has outperformed the broader market, posting a gain of more than 8% and ranking second globally. Wartime fiscal spending is expected to grow, which will provide support for the market. BitMine recently holds more than 4.8 million Ether—equivalent to more than 4.8 million Ethereum—showing bullish confidence and strategy.
MarketWhisper1h ago
Tom Lee: The crypto winter is about to come to an end, and BitMine is accelerating its purchases of Ethereum
Ethereum reserve firm BitMine has recently accelerated its purchases of ETH. Its ETH holdings have surpassed 4.8 million coins, and its asset size has reached $11.4 billion. The company’s chairman, Tom Lee, believes that the mini-crypto winter is nearing its end, and that ETH’s current price does not yet reflect its high usability and its position as a direction for future financial development.
BitMine accelerates buying ETH
BitMine disclosed its latest crypto holdings yesterday. As of April 6, BitMine holds assets worth $11.4 billion, including:
4,803,334 ETH
198 bitcoins
$92 million in Eightco Holdings stock (ORBS)
Beast worth $200 million
ChainNewsAbmedia1h ago
Gate Daily Report (April 7): SEC submits crypto “safe harbor” proposal to the White House; Argentina president and LIBRA call records exposed
Bitcoin gives back its gains on April 7, trading at $68,800. A U.S. SEC “safe harbor” proposal for crypto has been submitted for review by the White House. Argentina’s President Milei has been accused of having multiple calls with LIBRA’s founder, sparking a scandal. Bitcoin’s market volatility is high; it’s advised to control leverage to prevent large-scale liquidations.
MarketWhisper1h ago
Why is Bitcoin down today? Saudi petrochemical industrial facilities were hit, and Trump issued an ultimatum to Iran
Bitcoin (BTC) fell to about $68,800 on April 7, driven by geopolitical risks in the Middle East and Trump’s hardline remarks toward Iran. The Saudi explosion incident boosted global safe-haven sentiment, and technical indicators showed overbought pressure. In addition, Bitcoin’s key support lies in the $67,500 to $69,500 range; if it breaks below $66,000, the risk will widen to $64,000. Several analysts believe the pullback is more like a healthy correction rather than a trend reversal.
MarketWhisper2h ago
The Crypto Fear and Greed Index fell to 11 today, and the market is still in an extreme state of fear
Gate News, April 7: According to Alternative.me data, the Crypto Fear and Greed Index today dropped to 11, down further from yesterday’s 13. The market remains in an “extreme fear” state.
GateNews2h ago
