
Key Takeaways
-
Pump.fun (PUMP) has surged over 18% recently, extending its monthly gains to nearly 60%.
-
The daily chart shows a clear inverse head and shoulders pattern, a classic bullish reversal setup.
-
PUMP has reclaimed the 50-day moving average, which is now acting as key short-term support.
-
The $0.003025 neckline resistance is the critical breakout level to watch.
-
A confirmed breakout could target $0.004612, implying a potential 53% upside.
Pump.fun (PUMP), the native token of the popular Solana-based launchpad protocol, is quietly gaining traction in the crypto market. After posting a sharp 18%+ rally, PUMP has now extended its monthly gains to nearly 60%. While the price surge has caught traders’ attention, a closer look at the daily chart structure suggests this move could be part of a larger bullish setup — provided a key resistance level is cleared.
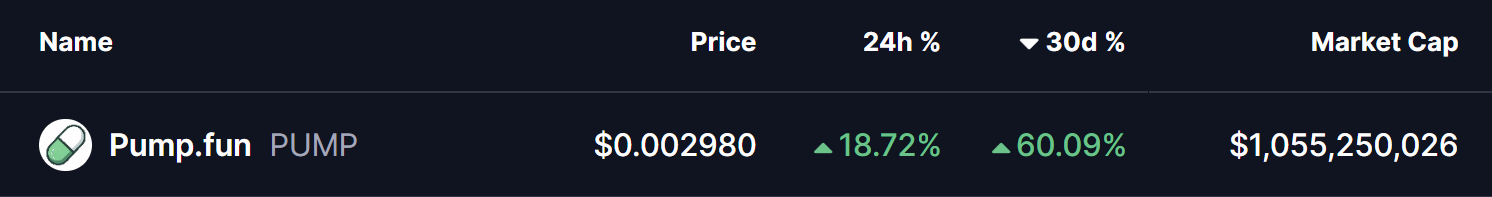
Source: Coinmarketcap
Inverse Head and Shoulders Pattern Takes Shape
On the daily timeframe, PUMP has carved out a well-defined inverse head and shoulders pattern, one of the most widely followed bullish reversal formations in technical analysis.
-
The left shoulder formed in early December near the $0.00247 region.
-
This was followed by a deeper pullback toward $0.00167, creating the head of the structure.
-
Price then recovered and found support again near $0.00225, completing the right shoulder.
Following the formation of this structure, PUMP rebounded steadily and has successfully reclaimed the 50-day moving average, which is now acting as dynamic support. The token is currently consolidating just below the neckline resistance around $0.003025, a level clearly highlighted on the chart.
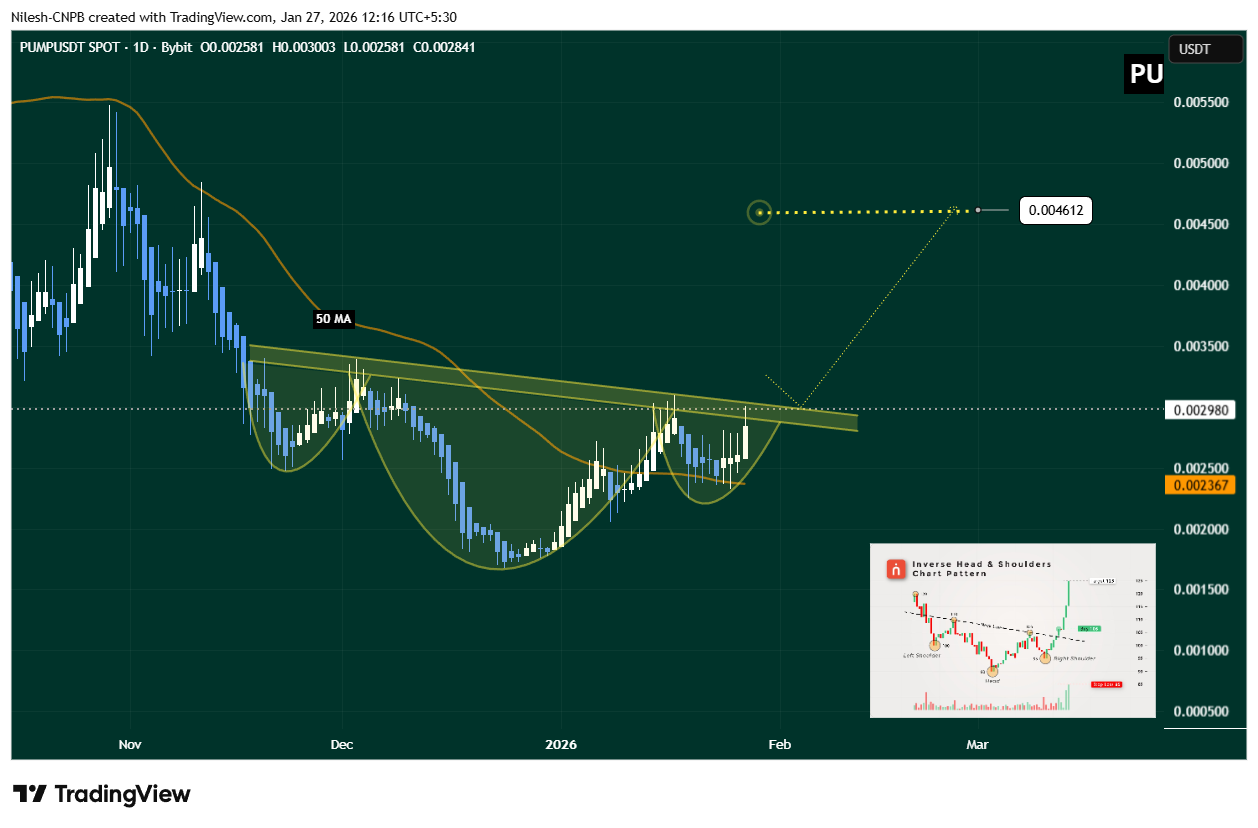
Pump.fun (PUMP) Daily Chart/Coinsprobe (Source: Tradingview)
This tightening price action near resistance often precedes a volatility expansion, suggesting a decisive move could be approaching.
What’s Next for PUMP?
For bullish momentum to gain confirmation, PUMP needs a strong daily close above the $0.003025 neckline, ideally followed by a successful retest of this zone as support. Such a move would validate the inverse head and shoulders breakout and signal a shift in short-term market structure.
Based on the measured move from the inverse head and shoulders pattern, a confirmed breakout could open the door for a price target near $0.004612 — representing a potential 53% upside from the breakout zone.
On the downside, failure to clear the neckline could lead to further consolidation. In that scenario, holding above the 50-day moving average and the $0.002367 support zone will be critical to keep the broader bullish setup intact.
Bottom Line
PUMP’s recent rally appears to be supported by a constructive chart pattern and improving momentum. As long as price continues to coil beneath neckline resistance while holding key support levels, the probability of a breakout remains elevated.
A decisive move above $0.003025 could mark the start of a fresh upside leg, while rejection would likely extend the current consolidation.
Disclaimer: The views and analysis presented in this article are for informational purposes only and reflect the author’s perspective, not financial advice. Technical patterns and indicators discussed are subject to market volatility and may or may not yield the anticipated results. Investors are advised to exercise caution, conduct independent research, and make decisions aligned with their individual risk tolerance.
About Author: Nilesh Hembade is the Founder and Lead Author of Coinsprobe, with over 5 years of experience in the cryptocurrency and blockchain industry. Since launching Coinsprobe in 2023, he has been providing daily, research-driven insights through in-depth market analysis, on-chain data, and technical research.
Disclaimer: The information on this page may come from third parties and does not represent the views or opinions of Gate. The content displayed on this page is for reference only and does not constitute any financial, investment, or legal advice. Gate does not guarantee the accuracy or completeness of the information and shall not be liable for any losses arising from the use of this information. Virtual asset investments carry high risks and are subject to significant price volatility. You may lose all of your invested principal. Please fully understand the relevant risks and make prudent decisions based on your own financial situation and risk tolerance. For details, please refer to
Disclaimer.
Related Articles
Tom Lee has released a post-war asset ranking, with Ethereum outperforming the broader market to win second place.
Tom Lee said on CNBC that since the start of geopolitical conflicts, Ethereum has outperformed the broader market, posting a gain of more than 8% and ranking second globally. Wartime fiscal spending is expected to grow, which will provide support for the market. BitMine recently holds more than 4.8 million Ether—equivalent to more than 4.8 million Ethereum—showing bullish confidence and strategy.
MarketWhisper11m ago
Tom Lee: The crypto winter is about to come to an end, and BitMine is accelerating its purchases of Ethereum
Ethereum reserve firm BitMine has recently accelerated its purchases of ETH. Its ETH holdings have surpassed 4.8 million coins, and its asset size has reached $11.4 billion. The company’s chairman, Tom Lee, believes that the mini-crypto winter is nearing its end, and that ETH’s current price does not yet reflect its high usability and its position as a direction for future financial development.
BitMine accelerates buying ETH
BitMine disclosed its latest crypto holdings yesterday. As of April 6, BitMine holds assets worth $11.4 billion, including:
4,803,334 ETH
198 bitcoins
$92 million in Eightco Holdings stock (ORBS)
Beast worth $200 million
ChainNewsAbmedia17m ago
Gate Daily Report (April 7): SEC submits crypto “safe harbor” proposal to the White House; Argentina president and LIBRA call records exposed
Bitcoin gives back its gains on April 7, trading at $68,800. A U.S. SEC “safe harbor” proposal for crypto has been submitted for review by the White House. Argentina’s President Milei has been accused of having multiple calls with LIBRA’s founder, sparking a scandal. Bitcoin’s market volatility is high; it’s advised to control leverage to prevent large-scale liquidations.
MarketWhisper34m ago
Why is Bitcoin down today? Saudi petrochemical industrial facilities were hit, and Trump issued an ultimatum to Iran
Bitcoin (BTC) fell to about $68,800 on April 7, driven by geopolitical risks in the Middle East and Trump’s hardline remarks toward Iran. The Saudi explosion incident boosted global safe-haven sentiment, and technical indicators showed overbought pressure. In addition, Bitcoin’s key support lies in the $67,500 to $69,500 range; if it breaks below $66,000, the risk will widen to $64,000. Several analysts believe the pullback is more like a healthy correction rather than a trend reversal.
MarketWhisper1h ago
The Crypto Fear and Greed Index fell to 11 today, and the market is still in an extreme state of fear
Gate News, April 7: According to Alternative.me data, the Crypto Fear and Greed Index today dropped to 11, down further from yesterday’s 13. The market remains in an “extreme fear” state.
GateNews1h ago
Can Trump’s ultimatum stop the ceasefire? Oil prices are rising, and Bitcoin has fallen to 68K
The market is concerned about the impending military action, causing U.S. crude oil (WTI) prices to break above $112 per barrel and the stock market to rise slightly. Bitcoin briefly climbed to $70,351, then subsequently fell to $68K, and Ether also dropped below $2,100. Investors are watching the Federal Reserve meeting minutes and the inflation indicator PCE data, as the economic outlook remains unclear.
ChainNewsAbmedia2h ago
