Dash (DASH) is under heavy selling pressure as the price drops about 3% at the time of recording on Thursday, extending a two-week-long weakening trend. This movement causes the 50-day Exponential Moving Average (EMA) around $55.93 to become a key threshold, attracting market attention.
In the context of waning demand for privacy coins, this asset group has fallen to the least effective position in the cryptocurrency market in recent months. Specifically for DASH, the derivatives market has experienced double-digit capital outflows, mainly driven by mass liquidations of long positions, reflecting a significant decline in investor interest and confidence.
Retail demand moves away from privacy coins
Data from Artemis shows that privacy-focused cryptocurrencies are among the most heavily sold assets in the market, with a decline of over 13% in the past month. This trend reflects a necessary correction after a hot rally at the end of 2025 and the early days of the current month, as demand gradually weakens.
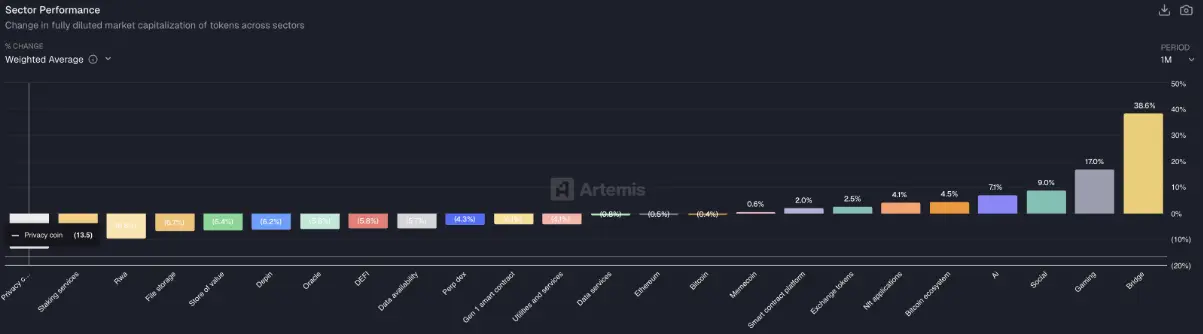 Sector performance data | Source: Artemis
In the derivatives market, DASH futures saw open interest (OI) plummet 13.69% in just 24 hours, down to $105.31 million. The sharp contraction of OI indicates capital is leaving the market, mainly due to mass liquidation of long positions and increasing risk-avoidance sentiment. Notably, the total value of long position liquidations in 24 hours reached $1.19 million, overwhelmingly surpassing the $52,910 in short positions, further reinforcing the bearish trend.
Sector performance data | Source: Artemis
In the derivatives market, DASH futures saw open interest (OI) plummet 13.69% in just 24 hours, down to $105.31 million. The sharp contraction of OI indicates capital is leaving the market, mainly due to mass liquidation of long positions and increasing risk-avoidance sentiment. Notably, the total value of long position liquidations in 24 hours reached $1.19 million, overwhelmingly surpassing the $52,910 in short positions, further reinforcing the bearish trend.
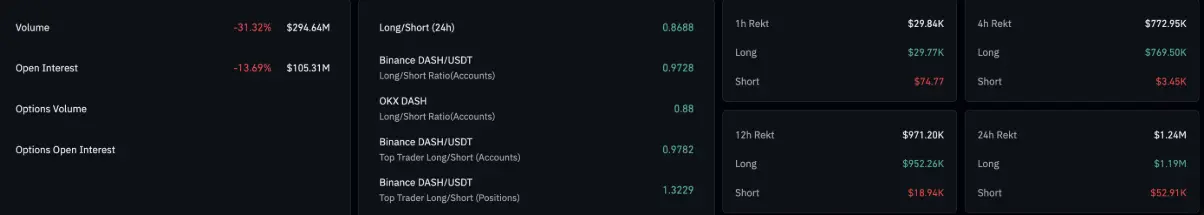 DASH derivatives data | Source: CoinGlass
Dash faces the risk of deeper correction towards $50
DASH has lost about 40% of its value in just two weeks, plunging toward the 50-day EMA at $55.93 — a price level where buying pressure is trying to “restrain” the decline. However, the technical picture remains negative as the 50-day EMA is trending downward and heading toward the 200-day EMA, indicating a prevailing bearish trend.
In the scenario where DASH closes below $55.93, the price is likely to fall further toward the psychological support zone of $50, approaching the 23.6% Fibonacci retracement level at $49.39. This level is derived from the peak of $150.00 on 11/4 down to the bottom of $35.04 on 12/19.
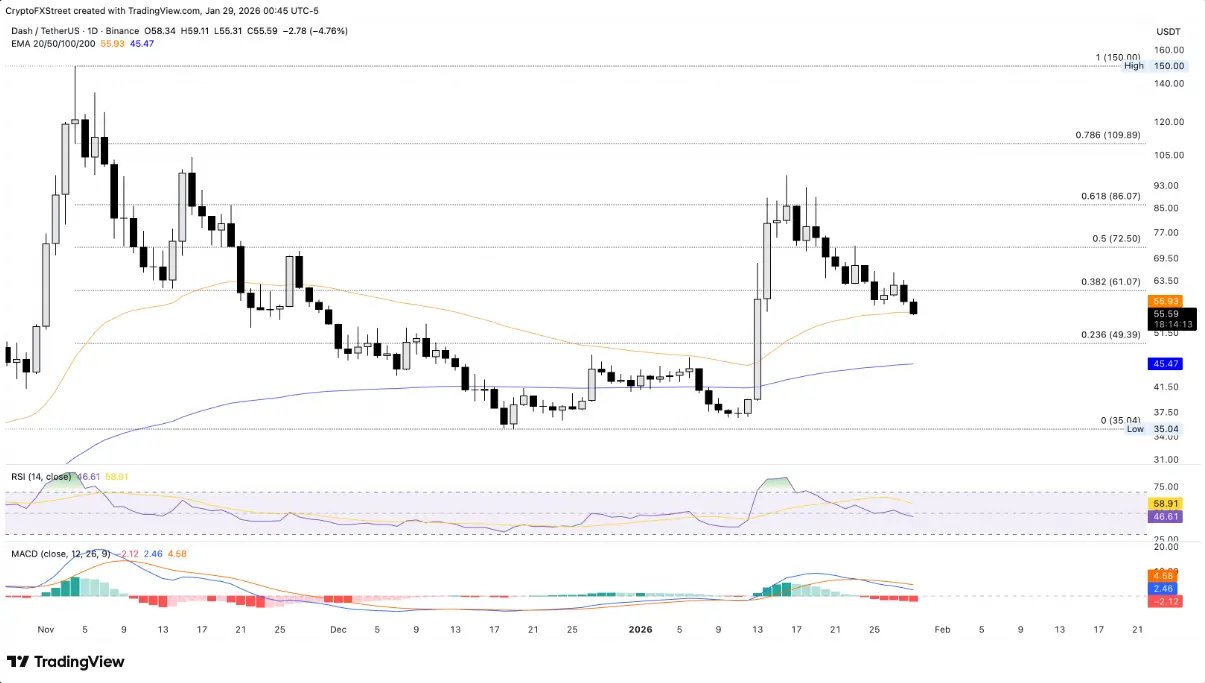 Daily DASH/USDT chart | Source: TradingView
Technical indicators on the daily timeframe also support the negative scenario. The MACD shows both signal lines continuing to decline below zero, while the negative histogram widens. The RSI is currently at 46, moving away from the neutral zone and trending downward, signaling early signs of increasing selling pressure.
Daily DASH/USDT chart | Source: TradingView
Technical indicators on the daily timeframe also support the negative scenario. The MACD shows both signal lines continuing to decline below zero, while the negative histogram widens. The RSI is currently at 46, moving away from the neutral zone and trending downward, signaling early signs of increasing selling pressure.
Conversely, if DASH can close above the 50-day EMA at $55.93, short-term downward pressure may ease somewhat, opening the possibility for a recovery toward the 38.2% Fibonacci retracement zone around $61.07.
Disclaimer: The information on this page may come from third parties and does not represent the views or opinions of Gate. The content displayed on this page is for reference only and does not constitute any financial, investment, or legal advice. Gate does not guarantee the accuracy or completeness of the information and shall not be liable for any losses arising from the use of this information. Virtual asset investments carry high risks and are subject to significant price volatility. You may lose all of your invested principal. Please fully understand the relevant risks and make prudent decisions based on your own financial situation and risk tolerance. For details, please refer to
Disclaimer.
Related Articles
DOGE Defends Key Support While On-Chain Activity Increases
DOGE active addresses jumped 28% in one week, showing growing network engagement.
Price holds critical levels near $0.0912–$0.0928 despite minor dips.
Breaking above $0.0930 could target $0.0950, $0.0980, and potentially $0.10.
Dogecoin — DOGE, has shown interesting movements this week,
CryptoNewsLand1h ago
Is Bitcoin mispricing a prolonged Iran war? Ex-hedge fund manager weighs in
James Lavish warns Bitcoin holders that continued conflict in Iran could trigger inflation and market downturns. While Bitcoin may face further declines, he sees potential long-term opportunities. He discusses the impact of global economic pressures on investments.
Cointelegraph1h ago
10x Research: Tether’s USDT issuance on Ethereum surpasses Tron—ETH could become the main beneficiary of stablecoin growth
10x Research noted that over the past five years, Ethereum (ETH) has performed lackluster, with its price trading around $2,000, mainly due to weak on-chain activity leading to insufficient demand. After falling 57% from its 2025 peak, ETH’s current valuation remains low, while capital accumulation is still ongoing; USDT’s issuance has surpassed Tron, sparking discussion that ETH could become a leading beneficiary of stablecoin growth. Analysts are now re-evaluating ETH’s potential turning point.
GateNews1h ago
Bitcoin Holds Steady Near $67K Amid Bullish and Geopolitical Tension
This weekend, Bitcoin ($BTC) has shown a steady performance in line with a blend of technical and geopolitical outlook. In this respect, Bitcoin ($BTC) is changing hands at $67K with significant support levels at $64K and $65K and notable resistance at $74K. As per the data from CRYPTO Damus, the
BlockChainReporter1h ago
XRP Trading Volume Drops by 50% as the Altcoin Records Six Consecutive Red Monthly Closes
XRP trading volume drops by 50%, feeding bearish expectations.
The altcoin records six consecutive red monthly closes.
Could this be the longest coil for XRP before the biggest launch?
The crypto community is disheartened to see the
CryptoNewsLand4h ago
VanEck Research Head: BTC derivatives protection demand hits the 99th percentile, releasing a contrarian long setup signal
VanEck research chief Matthew Sigel noted that protective demand in the Bitcoin derivatives market has reached a historical high, suggesting the market may be suitable for establishing long positions. At the same time, he warned that high spending in the AI sector without returns could put pressure on the market.
GateNews4h ago
