Quant (QNT) has recorded an impressive 12.33% growth over the past 36 hours, while the daily trading volume has tripled since Friday, January 16. This strong upward momentum occurs amid Bitcoin (BTC) maintaining a solid local support zone at $94,500, which previously served as resistance in December and until recently.
The potential for Bitcoin to reach the $100,000 mark has motivated altcoins, opening up significant short-term upside opportunities.
Long-term trend of QNT remains positive
On the weekly chart, QNT is establishing a solid bullish structure. The strong growth in November 2024 helped QNT surpass its previous high at $149.6. Moving into 2025, the weekly chart shows QNT forming a higher low at $58.60, reinforcing the long-term bullish outlook.
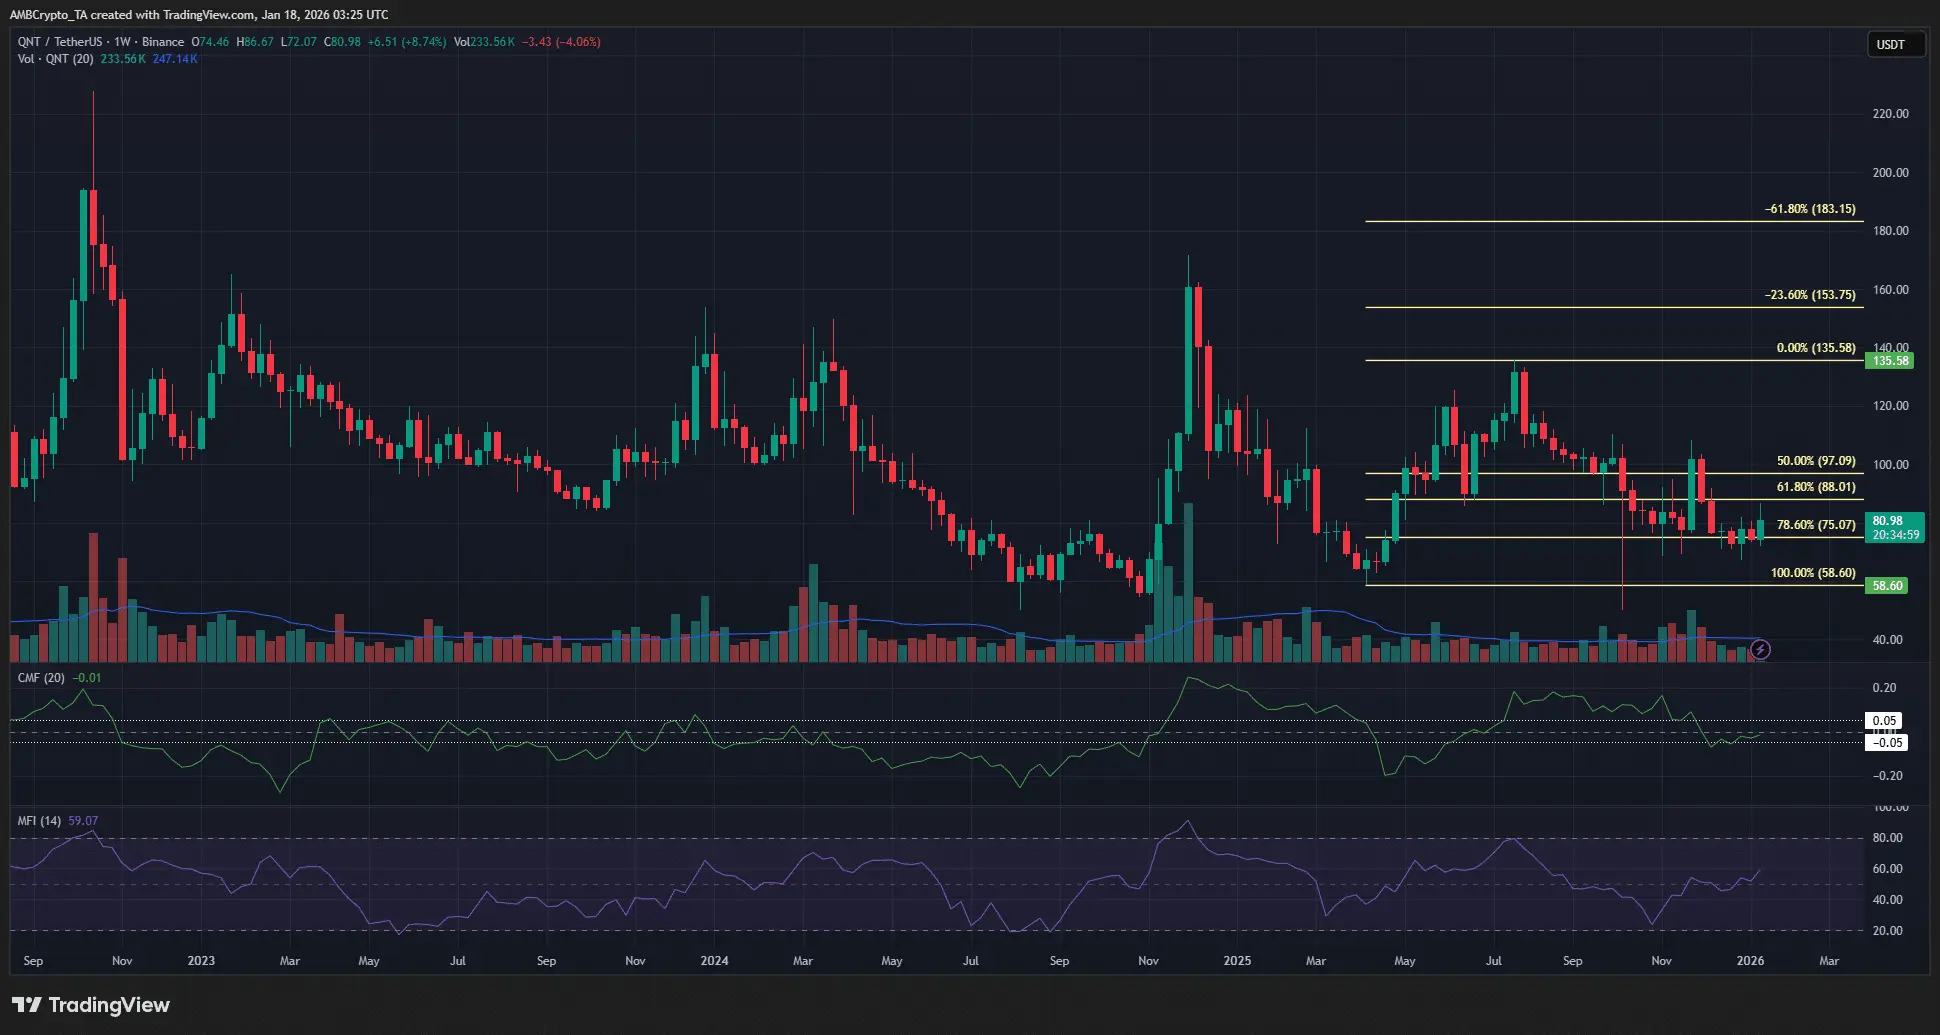 Source: TradingView In recent months, QNT has retraced to the 78.6% Fibonacci level at $75. The buying side has successfully defended this support zone since November, indicating strong demand.
Last week, QNT continued to rise by 8.03%, which could be an early signal of a long-term bullish reversal cycle.
The end of QNT’s correction phase will open up attractive investment opportunities, though certain risks remain. Currently, BTC itself still maintains a bearish structure on the weekly chart, with supply zones at $101,000 and $108,000 potentially exerting selling pressure and hindering BTC’s upward momentum.
Potential risks for long-term investors
Long-term holders should be cautious of the risk of QNT’s price falling further, driven by BTC’s volatility and the overall market sentiment, which is currently oscillating from neutral to cautious. Therefore, the ideal timing for long-term investment has not yet arrived.
Short-term trading strategy – Opportunity to establish positions
On the 4-hour timeframe, QNT maintains an upward structure, creating favorable conditions for traders to open buy positions. The capital rotation trend into altcoins is expected to continue over the next few weeks, providing profit opportunities for Quant holders.
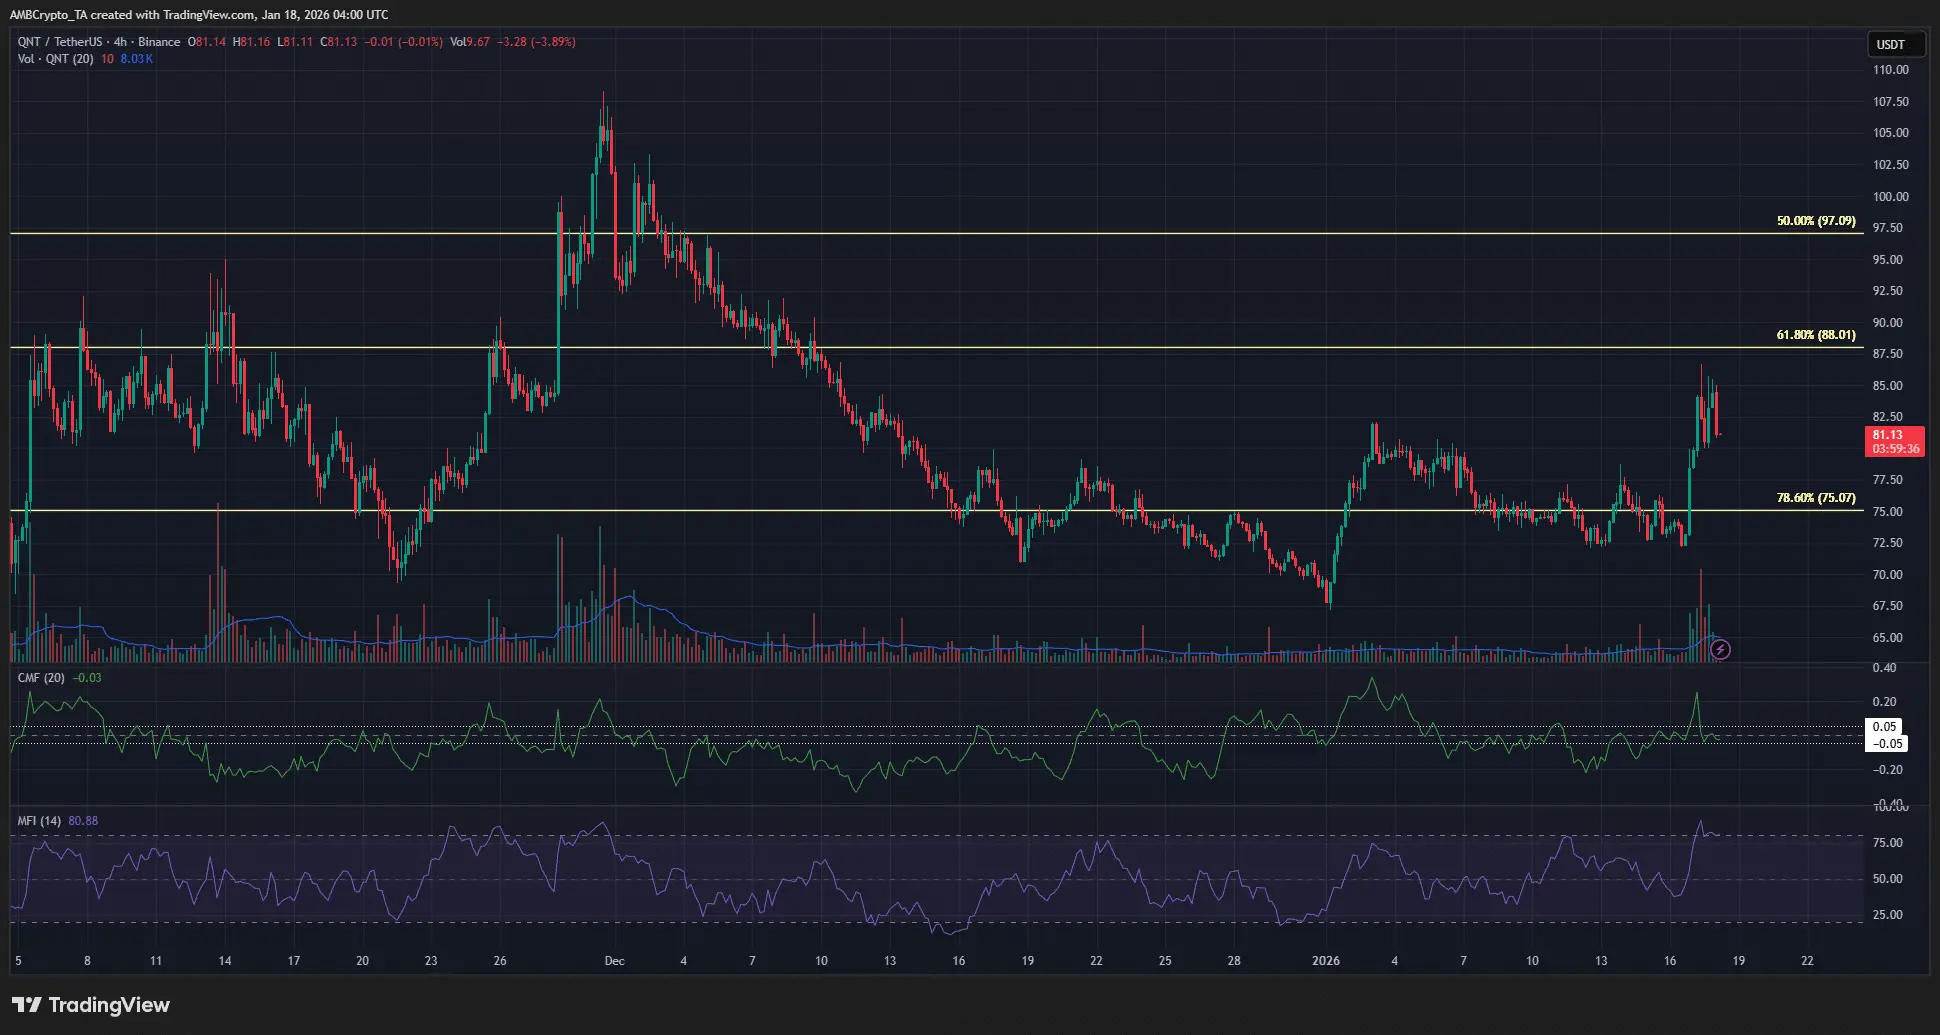 Source: TradingView However, if the 4-hour closing price falls below $72.5, the bullish scenario will be invalidated. Important supply zones above at $90 and $110 are levels where buyers might consider taking profits.
Notably, the net outflow on QNT trading platforms over the past three days has been consistently negative, reflecting strong accumulation trends from investors.
Disclaimer: The information on this page may come from third parties and does not represent the views or opinions of Gate. The content displayed on this page is for reference only and does not constitute any financial, investment, or legal advice. Gate does not guarantee the accuracy or completeness of the information and shall not be liable for any losses arising from the use of this information. Virtual asset investments carry high risks and are subject to significant price volatility. You may lose all of your invested principal. Please fully understand the relevant risks and make prudent decisions based on your own financial situation and risk tolerance. For details, please refer to
Disclaimer.
Related Articles
Bearish sentiment builds in crypto as volatility and hedging rise
The crypto market exhibited signs of volatility on Tuesday, with bitcoin BTC$66,223.90 spiking to $68,300 shortly after midnight UTC before tumbling back to $66,500.
The initial spike was spurred by reports that U.S. President Donald Trump was willing to end the war in Iran without the Strait of
CoinDesk3m ago
Stablecoins grow faster than expected as more new applications emerge
Stablecoin is experiencing faster growth than expected, driven by new applications like AI payments. However, Standard Chartered maintains its forecast of a $2 trillion market cap by 2028.
TapChiBitcoin23m ago
PI Network (PI) Price Predictions for This Week
PI Network's price has corrected from $0.30 to $0.17, indicating a 40% drop. Currently, it hovers around $0.18, presenting a bearish outlook unless it surpasses $0.20. Volume remains low, suggesting indecision among sellers, while the RSI stays under 50, signaling further potential declines.
CryptoPotato29m ago
BTC drops 0.58% in 15 minutes: a pullback triggered by on-chain capital flows accelerating and a resonance with macro uncertainty
2026-03-31 09:45 to 10:00 (UTC), BTC recorded a return of -0.58% within 15 minutes, with a trading range of 65,996.1–66,509.1 USDT, a volatility of 0.77%. Short-term fluctuations intensified, drawing market attention. Total on-chain transfers reached 420,000, with the number of transactions as high as 27,986, indicating rapid capital movement and a phased increase in market participation, though overall trading remains cautious.
The primary drivers behind this deviation are on-chain large-capital reallocation activity and an acceleration in fund flows. On-chain data shows that both the total transfer volume and the number of transactions have risen together
GateNews43m ago
ETH 15-minute drop of 0.61%: Main capital accelerates outflows and on-chain activity declines in sync, suppressing the market
2026-03-31 09:45 to 2026-03-31 10:00 (UTC), the ETH price fluctuated between 2012.5 and 2030.74 USDT. The 15-minute K-line return rate was -0.61%, and the amplitude reached 0.90%. Among major coins, performance was relatively weak; short-term market attention increased, volatility slightly worsened, and selling pressure was clearly released.
The main driving force behind this unusual move is that large funds continued to flow out throughout the day; from 09:45 to 10:00, the outflow intensity further increased. According to on-chain and trading data, on March 3rd, the outflow of main funds persisted, indicating sustained selling pressure and a lack of buying support, which contributed to the continued downward trend in ETH prices.
GateNews43m ago
