
Bitcoin is once again approaching a level that carries real historical weight. According to the CryptoQuant chart, price is moving toward the 365-day moving average, a long-term trend line that played a decisive role during the 2022 bear market.
Back then, this same moving average acted as a ceiling. Bitcoin briefly bounced, failed to reclaim it, and rolled over into a deeper drawdown. That context is why traders are watching this zone so closely now.
- BTC Chart
- Why This Level Matters So Much
- Momentum Indicators Add Caution
- A Balanced Take
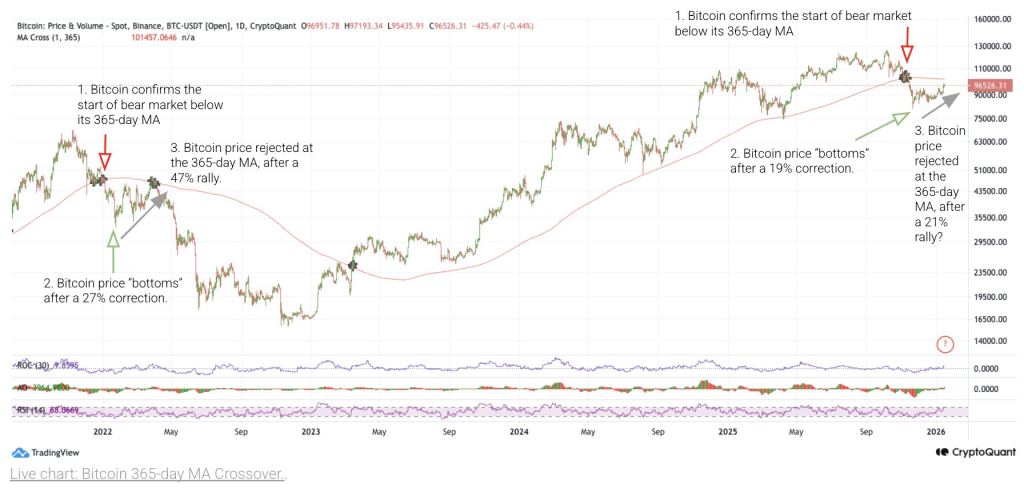
BTC Chart
The 365-day moving average sits near the $100,000–$101,000 area. Bitcoin is currently trading below it, which matters. In long-term trend analysis, reclaiming this line often signals a return to a sustained bull market. Failing to do so keeps the market in a defensive posture.
Looking at past cycles on the chart, the pattern is clear. In 2022, Bitcoin dropped below the 365-day MA, attempted a recovery rally of roughly 47%, and then got rejected. Only after a much deeper correction did price finally form a durable bottom.
In the current setup, Bitcoin has already experienced a notable pullback, roughly in the 20% range from recent highs. That correction is similar in size to previous “mid-cycle” declines, not full capitulation events. The question now is whether this pullback is enough.
Source: X/@coinbureau
Why This Level Matters So Much
This is not just a moving average. It’s a line that long-term investors, funds, and systematic strategies all watch. When Bitcoin trades below it, rallies tend to be sold. When price holds above it, dips tend to be bought.
Right now, the market is in between. Bitcoin has bounced, but it has not reclaimed the level that would confirm strength. If price pushes into the $100K–$101K area and gets rejected again, it would mirror the early stages of the 2022 bear market structure.
On the other hand, a clean daily and weekly close above the 365-day MA would weaken the bearish case significantly. That would suggest the market has absorbed selling pressure and is ready to move higher.
Read also: Copper Crisis Is Just Getting Started: The Best Stocks to Watch
Momentum Indicators Add Caution
Momentum on the chart looks mixed. RSI is no longer oversold, but it also isn’t showing strong bullish divergence. Volume during the rebound has been solid, but not explosive. That points to a market that is stabilizing, not accelerating.
This kind of price behavior often leads to chop and volatility rather than immediate continuation in either direction.
A Balanced Take
This chart does not guarantee a bear market. It does, however, justify caution.
Bitcoin is at a decision point. Bulls need to reclaim the 365-day moving average and hold it. Bears are watching for another rejection to confirm that this rally is corrective, not structural.
Until one of those outcomes happens, the market remains vulnerable to sharp moves in either direction. In simple terms, this is not a place for complacency.
The next interaction with this level may define not just the next few weeks, but the broader trend for the rest of the year.
Disclaimer: The information on this page may come from third parties and does not represent the views or opinions of Gate. The content displayed on this page is for reference only and does not constitute any financial, investment, or legal advice. Gate does not guarantee the accuracy or completeness of the information and shall not be liable for any losses arising from the use of this information. Virtual asset investments carry high risks and are subject to significant price volatility. You may lose all of your invested principal. Please fully understand the relevant risks and make prudent decisions based on your own financial situation and risk tolerance. For details, please refer to
Disclaimer.
Related Articles
Bitdeer releases March operating report: BTC production up 480% year over year
Bitdeer Technologies Group (NASDAQ: BTDR) released its 2026 March unaudited production and operations update via Globe Newswire on April 15. The data show that it mined 661 bitcoins in March, up about 480% year-over-year versus the same period in 2025. Its self-mining computing power increased year over year by about 504% to approximately 70 EH/s.
MarketWhisper19m ago
ETH/BTC ratio rebounds—are institutional funds rotating? A deep dive into structural signals in the crypto market
BTC breaks through $75,000; the Iran–Israel ceasefire and fresh highs in U.S. stocks lift risk assets, but the options market remains somewhat cautious. The ETH/BTC ratio rebounds, signaling capital rotation.
GateInstantTrends20m ago
Tether Acquires 951.35 BTC Worth $70.47M from Centralized Exchange
Gate News message, Tether purchased 951.35 BTC valued at $70.47 million from a centralized exchange. Following this transaction, Tether's total Bitcoin holdings have reached 97,204 BTC, valued at approximately $7.28 billion.
GateNews27m ago
Crypto Market Rebounds 1.5% to $2.54T as Bitcoin Leads Rally Amid Tech Surge and Policy Progress
The crypto market rebounded 1.5% to $2.54 trillion, led by Bitcoin's 7% gain amid easing geopolitical tensions and strong ETF inflows. Analysts predict further gains if Bitcoin surpasses $76K resistance.
GateNews50m ago
Bitcoin Hits $76,000 Resistance as Exchange Inflows Signal Sell Pressure
Bitcoin reached US$76,000 on April 15, 2026, its highest level since early February, before retreating to US$74,800 as selling activity increased, according to on-chain data from CryptoQuant. Hourly exchange inflows surged to approximately 11,000 BTC, the highest since December 2025, while average d
CryptoFrontier1h ago
BlackRock Bitcoin ETF Holds $59.31B in BTC at Average Cost of $89K
BlackRock's Bitcoin ETF holds $59.31 billion in Bitcoin at an average cost of $89,000 per BTC, rebounding over $11 billion since its bottom on February 25 amid recent Bitcoin price recovery.
GateNews1h ago
