For most of this cycle, the LINK price has followed a pretty familiar script on the LINK/BTC chart. It rallies, runs into resistance, then slowly rolls over and heads lower again.
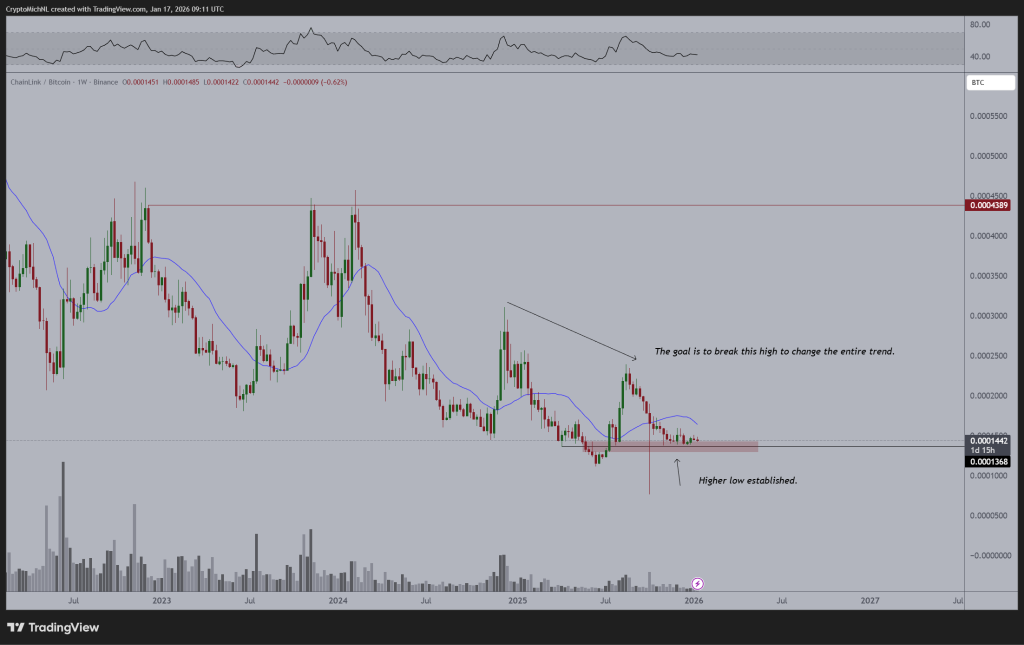
That’s why Michaël van de Poppe’s comment stands out this time. When he says the chart is forming the first higher low since the bear market, it’s not just talk. You can see it clearly on the chart.
Instead of a breakdown into brand-new lows beneath the region of $12.00-$12.50, LINK saw a price action lower into a region of support around $13.70. This in itself does not mean a reversal of the trend but does indicate that some form of change is taking place beneath the surface level of the market action. Such change usually happens before a major movement and not after.
- Why This Higher Low Matters More Than It Looks
- The Level That Decides Everything for LINK
- What’s Next for LINK?
Why This Higher Low Matters More Than It Looks
Looking at the right side of the chart shared by Michaël, the LINK price pushed sharply into support, printed a long downside wick near $13.70, and then bounced. That zone has now turned into a base, and sellers haven’t been able to force a breakdown below it so far. That’s a big difference compared to earlier phases of the downtrend.
Source: X/@CryptoMitchNL
In previous attempts, every bounce eventually gave way to lower lows under $13.00. This time, the LINK price stopped higher and started consolidating above support. That tells you buyers are stepping in earlier, which is often how trend changes begin.
As long as LINK holds above the $13.50–$13.70 region, pullbacks start to look more like healthy retests rather than warning signs.
The Level That Decides Everything for LINK
Still, the chart makes one thing very clear. The LINK price has a major hurdle overhead. The prior swing high around $16.50–$17.00 is the level that needs to break to actually flip the trend. Until that happens, this move remains a recovery phase, not a confirmed reversal.
There’s also a key moving average cutting through the chart near $15.00 that has capped upside for months. The LINK price is now pressing into that area again. A clean break and hold above $15.00 would increase the chances of a push toward $17.00. If that level rejects price again, LINK could spend more time ranging between $13.70 and $15.00.
Chainlink (LINK) Whales Are Loading Up and the $100 LINK Conversation Is Back_**
What’s Next for LINK?
Momentum indicators aren’t showing extreme conditions right now, and that’s not a bad thing. The LINK price isn’t overheated above $18.00, nor is it collapsing under support. It’s sitting in a decision zone where the market has to prove whether this higher low actually matters.
If this base continues to hold and the LINK price starts challenging $16.50 and beyond, the structure finally begins to change. Until then, this is the quiet phase, where the chart builds pressure before revealing its next real direction.
Disclaimer: The information on this page may come from third parties and does not represent the views or opinions of Gate. The content displayed on this page is for reference only and does not constitute any financial, investment, or legal advice. Gate does not guarantee the accuracy or completeness of the information and shall not be liable for any losses arising from the use of this information. Virtual asset investments carry high risks and are subject to significant price volatility. You may lose all of your invested principal. Please fully understand the relevant risks and make prudent decisions based on your own financial situation and risk tolerance. For details, please refer to
Disclaimer.
Related Articles
CTSI Price Soars 17.57%: Institutional Interest Ramps Up
Amid a crypto market downturn, CTSI surged 17.57% to $0.03626 in an hour, driven by high trading volume and institutional interest in altcoins. Traders are now watching key support and resistance levels for future price movements.
Coinfomania1h ago
Bitcoin falls below 71,500 USD, U.S.-Iran talks remain deadlocked, and the Strait of Hormuz becomes the biggest point of contention
On April 11, the U.S. and Iran began 20 hours of negotiations in Pakistan. The core issue was freedom of passage through the Strait of Hormuz. After Bitcoin briefly rose to $73,800, it quickly fell back to $71,557. The U.S. side took a hardline stance, demanding that Iran open the strait, while Iran insisted that easing restrictions must wait until a comprehensive agreement is reached. The two sides have not yet reached a consensus.
動區BlockTempo5h ago
Crypto Market Maintains Steady Growth Trajectory As Top Assets Show Gains
The crypto market continues to grow, with a market cap of $2.44T and Bitcoin and Ethereum showing slight increases. Top gainers include $GPM and $BASE. Meanwhile, DeFi TVL declined, NFT sales rose, and notable developments include a trader's significant loss and a push for regulatory clarity in Congress.
BlockChainReporter6h ago
BTC 15-minute chart slightly down 0.57%: leveraged long positions passively cut risk and macro sentiment disturbances drive volatility
2026-04-12 12:45 to 13:00 (UTC), the BTC price range was 71081.7 to 71493.2 USDT, with an amplitude of 0.58%. Within 15 minutes, the return recorded was -0.57%. During the period of unusual activity, market volatility increased somewhat, risk sentiment warmed up, and overall attention rose; however, there was no extreme surge in volume or a sudden drop in liquidity.
The main driver behind this unusual activity is that, under the leverage structure, long positions were reduced passively. Recently, the funding rate for perpetual contracts turned from negative to positive. Leverage among longs in the market accumulated; the price dipped slightly, triggering liquidations of some leveraged long positions and sell orders for position closures, resulting in
GateNews8h ago
Analyst: Bitcoin’s current pullback is relatively mild compared with past ones, but the bottom has not been confirmed yet.
Crypto analyst Axel Adler Jr said the current Bitcoin pullback is smaller than historic bearish-market levels, but a bottom has not yet been confirmed. He believes the market is still in a mild bear phase, and that a true recovery will require patience and waiting.
GateNews10h ago
Bitcoin long-term holdings increased to 12.4 million coins, and the 30-day change has remained positive.
CryptoQuant analyst Darkfost says the Bitcoin market is entering an early stabilization phase, with stronger long-term holding behavior. The amount of BTC held for more than a year has increased, and investors are more inclined to hold than to distribute. This suggests the market is transitioning toward long-term conviction; the current trend is viewed as an early stability signal, but it needs longer-term confirmation.
GateNews11h ago
