
**Date: **Tue, Jan 06, 2026 | 10:08 AM GMT
The broader cryptocurrency market continues to show fresh strength at the start of the new year. Both Bitcoin (BTC) and Ethereum (ETH) are posting weekly gains of over 6%, helping restore confidence across the market. This improving sentiment is now spilling over into major altcoins — including Jupiter (JUP).
JUP has already delivered an impressive 20% gain on the week. While the short-term momentum is encouraging, the more important development is unfolding on the higher-timeframe chart. Recent price action suggests a meaningful shift in market behavior, hinting that JUP could be transitioning from a corrective phase into a broader bullish continuation if key resistance zones are reclaimed.
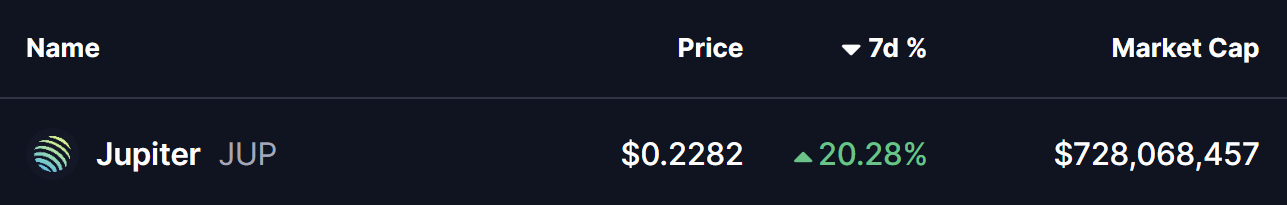
Source: Coinmarketcap
Rounding Bottom Formation Taking Shape
On the daily chart, Jupiter appears to be forming a rounding bottom pattern — a classic bullish reversal structure that typically develops after extended downside pressure and gradual seller exhaustion.
This setup began after JUP faced a strong rejection from the $0.4540–$0.4760 resistance zone in late October. That rejection triggered a sharp sell-off, dragging price lower toward the $0.17 region. However, bears failed to maintain control beyond that point. Selling pressure faded, demand began to absorb supply, and price started stabilizing.
Over time, volatility compressed and JUP began curling higher in a smooth, rounded fashion — closely matching the textbook behavior of a developing rounding bottom. Importantly, the recent recovery has pushed price back above the 50-day moving average around $0.2192, a level that previously capped upside attempts and now appears to be turning into support.
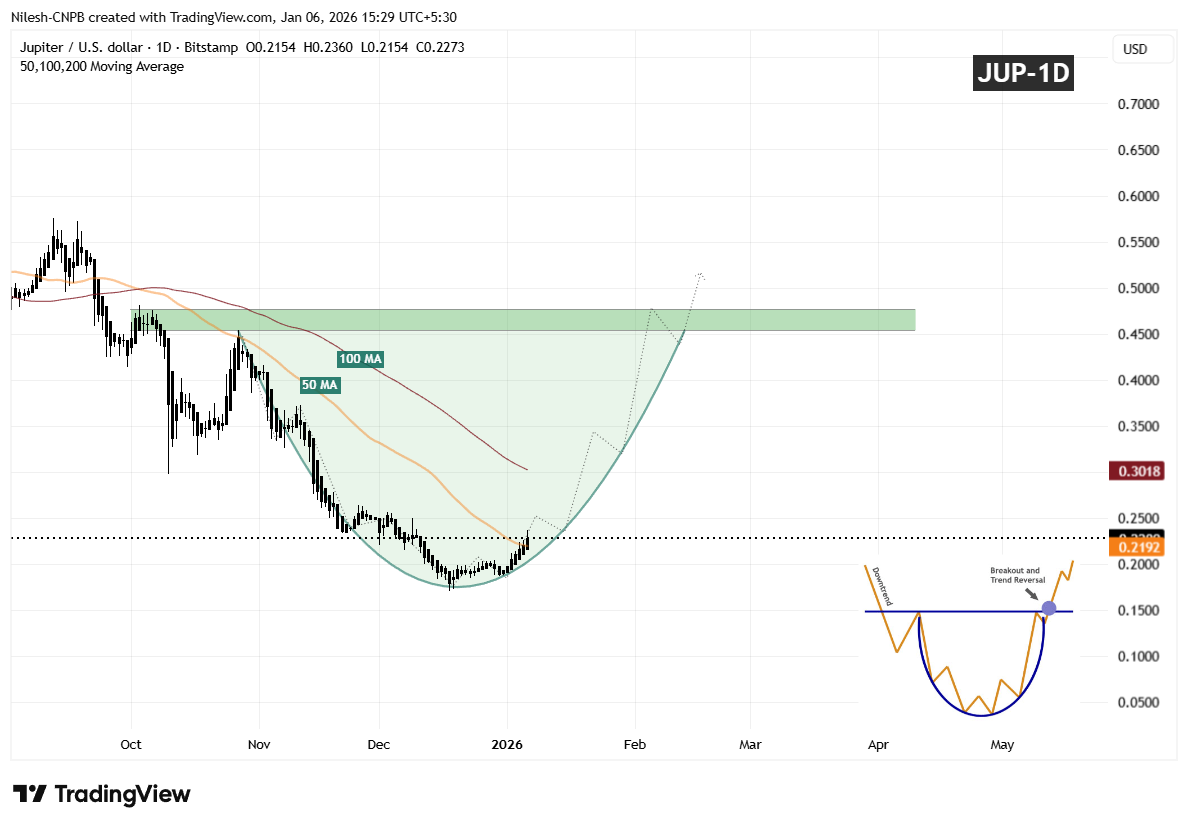
Jupiter (JUP) Daily Chart/Coinsprobe (Source: Tradingview)
The gradual slope of the recovery suggests organic accumulation rather than speculative spikes, reinforcing the credibility of the developing base.
What’s Next for JUP?
If JUP continues to hold above the 50-day moving average, this level could serve as a solid foundation for further upside, with the 100-day moving average acting as the next upside magnet in the near term.
A clean and decisive breakout above the $0.4540–$0.4760 resistance zone, followed by sustained acceptance above that area, would confirm the rounding bottom reversal and likely open the door for a broader bullish expansion phase.
Until that breakout occurs, the pattern remains in development. Some short-term consolidation or shallow pullbacks are possible as price digests recent gains. However, as long as JUP continues to print higher lows above the established base, the broader structure remains constructive.
For now, the chart suggests Jupiter is approaching a critical confirmation phase — one that could determine whether this recovery matures into a sustained bullish trend as 2026 progresses.
Disclaimer: The views and analysis presented in this article are for informational purposes only and reflect the author’s perspective, not financial advice. Technical patterns and indicators discussed are subject to market volatility and may or may not yield the anticipated results. Investors are advised to exercise caution, conduct independent research, and make decisions aligned with their individual risk tolerance.
About Author: Nilesh Hembade is the Founder and Lead Author of Coinsprobe, with over 5 years of experience in the cryptocurrency and blockchain industry. Since launching Coinsprobe in 2023, he has been providing daily, research-driven insights through in-depth market analysis, on-chain data, and technical research.
Disclaimer: The information on this page may come from third parties and does not represent the views or opinions of Gate. The content displayed on this page is for reference only and does not constitute any financial, investment, or legal advice. Gate does not guarantee the accuracy or completeness of the information and shall not be liable for any losses arising from the use of this information. Virtual asset investments carry high risks and are subject to significant price volatility. You may lose all of your invested principal. Please fully understand the relevant risks and make prudent decisions based on your own financial situation and risk tolerance. For details, please refer to
Disclaimer.
Related Articles
Humanity Protocol Rallies 80% From April Lows, But Is the Momentum Fading?
Humanity Protocol surged 80% from April lows, breaking into top 100 crypto assets.
Whale activity and network growth rose, but trading volume dropped sharply by 46%.
Bullish structure remains intact, with key resistance and support levels defining the next move.
Humanity Protocol — H, ha
CryptoNewsLand1h ago
PENGU Eyes 30% Rally as Analyst Flags Crucial Breakout Level
PENGU consolidates near $0.009 resistance after a long 90% decline from highs.
Analysts expect a 30% rally if breakout above key resistance level confirms strength.
ETF speculation and ecosystem growth could fuel volatility and upside momentum.
Pudgy Penguins — PENGU, is sitting at a
CryptoNewsLand3h ago
Analyst: $80K Emerges as Bitcoin's Key Resistance Level, Breakout Could Trigger Increased Volatility
Gate News message, April 26 — On-chain analyst Murphy identified $80,000 as Bitcoin's primary resistance level above the current price, citing a combination of options Gamma exposure, open interest (OI), and implied volatility (IV) data. The level represents a critical checkpoint for May's price
GateNews4h ago
Crypto Fear and Greed Index Falls to 32, Indicating Panic State
Gate News message, April 26 — The Crypto Fear and Greed Index currently stands at 32, up 2 points from the previous day, according to Coinglass data. The index is in a panic state.
The seven-day average is 34, while the 30-day average is 19, indicating elevated market anxiety over the past
GateNews4h ago
PLA Plummets 47.8% in 30 Minutes, Dropping Below $0.12
Gate News message, April 26 — PLA (PlayDapp) price crashed 47.8% in just 30 minutes today, falling to $0.1225. The token, which hit a day high of $0.2347, now trades at $0.122512 with a market cap of approximately $305 million. Trading volume remains notably low, reflecting reduced investor
GateNews5h ago
7-Day AI Coin Performance Explodes — Are These 5 Tokens Worth Buying Right Now?
These tokens’ weekly performance reflects different degrees of stability, speculation, and maturity.
Social factors and interactions also contributed to short-term price dynamics.
Those with larger ecosystems appear to have more stable price movements than highly volatile assets.
There h
CryptoNewsLand9h ago