
**Date: **Tue, Jan 06, 2026 | 10:08 AM GMT
The broader cryptocurrency market continues to show fresh strength at the start of the new year. Both Bitcoin (BTC) and Ethereum (ETH) are posting weekly gains of over 6%, helping restore confidence across the market. This improving sentiment is now spilling over into major altcoins — including Jupiter (JUP).
JUP has already delivered an impressive 20% gain on the week. While the short-term momentum is encouraging, the more important development is unfolding on the higher-timeframe chart. Recent price action suggests a meaningful shift in market behavior, hinting that JUP could be transitioning from a corrective phase into a broader bullish continuation if key resistance zones are reclaimed.
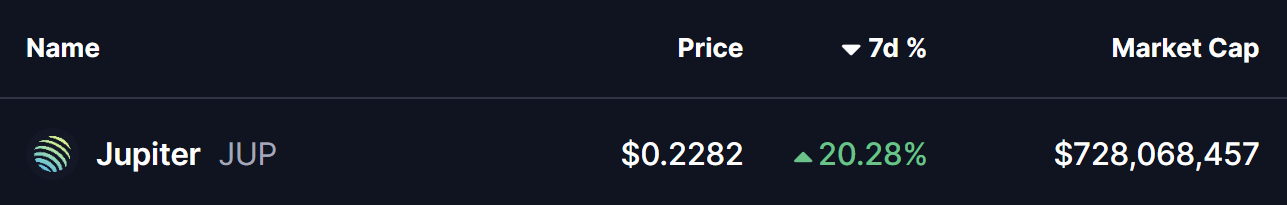
Source: Coinmarketcap
Rounding Bottom Formation Taking Shape
On the daily chart, Jupiter appears to be forming a rounding bottom pattern — a classic bullish reversal structure that typically develops after extended downside pressure and gradual seller exhaustion.
This setup began after JUP faced a strong rejection from the $0.4540–$0.4760 resistance zone in late October. That rejection triggered a sharp sell-off, dragging price lower toward the $0.17 region. However, bears failed to maintain control beyond that point. Selling pressure faded, demand began to absorb supply, and price started stabilizing.
Over time, volatility compressed and JUP began curling higher in a smooth, rounded fashion — closely matching the textbook behavior of a developing rounding bottom. Importantly, the recent recovery has pushed price back above the 50-day moving average around $0.2192, a level that previously capped upside attempts and now appears to be turning into support.
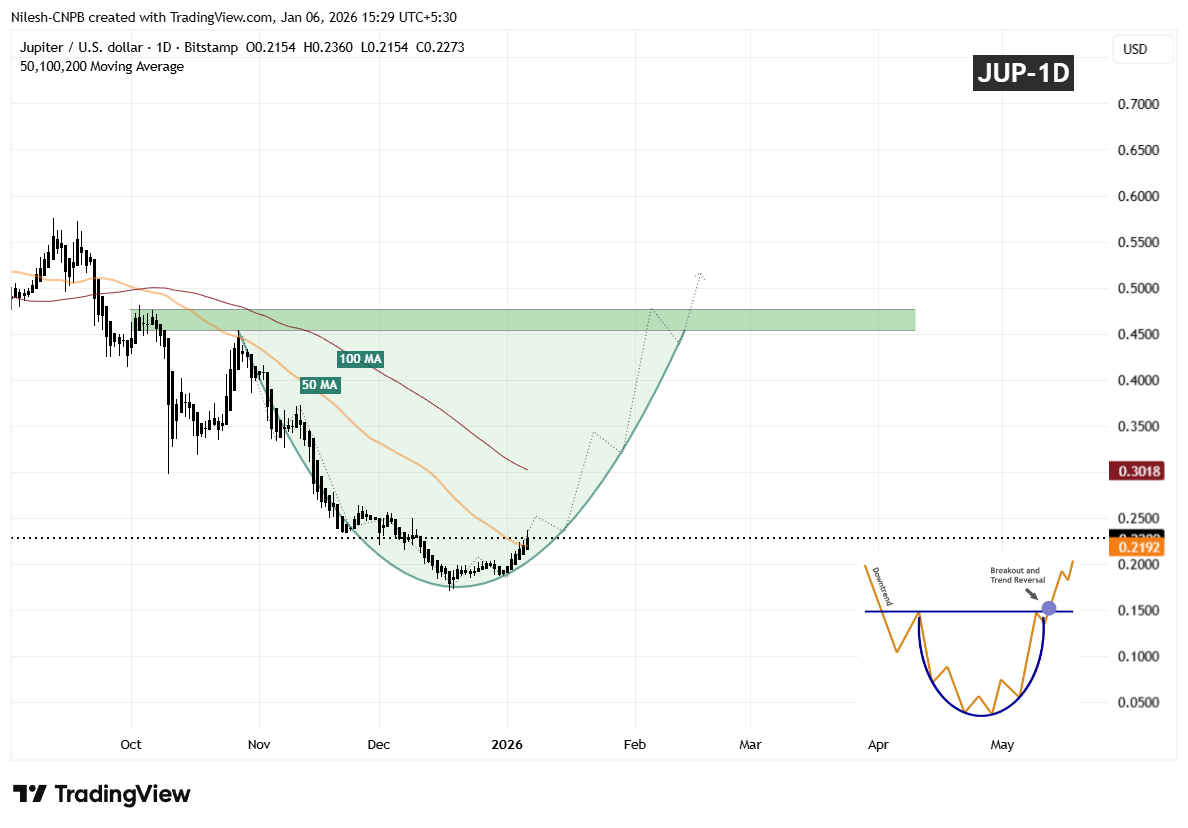
Jupiter (JUP) Daily Chart/Coinsprobe (Source: Tradingview)
The gradual slope of the recovery suggests organic accumulation rather than speculative spikes, reinforcing the credibility of the developing base.
What’s Next for JUP?
If JUP continues to hold above the 50-day moving average, this level could serve as a solid foundation for further upside, with the 100-day moving average acting as the next upside magnet in the near term.
A clean and decisive breakout above the $0.4540–$0.4760 resistance zone, followed by sustained acceptance above that area, would confirm the rounding bottom reversal and likely open the door for a broader bullish expansion phase.
Until that breakout occurs, the pattern remains in development. Some short-term consolidation or shallow pullbacks are possible as price digests recent gains. However, as long as JUP continues to print higher lows above the established base, the broader structure remains constructive.
For now, the chart suggests Jupiter is approaching a critical confirmation phase — one that could determine whether this recovery matures into a sustained bullish trend as 2026 progresses.
Disclaimer: The views and analysis presented in this article are for informational purposes only and reflect the author’s perspective, not financial advice. Technical patterns and indicators discussed are subject to market volatility and may or may not yield the anticipated results. Investors are advised to exercise caution, conduct independent research, and make decisions aligned with their individual risk tolerance.
About Author: Nilesh Hembade is the Founder and Lead Author of Coinsprobe, with over 5 years of experience in the cryptocurrency and blockchain industry. Since launching Coinsprobe in 2023, he has been providing daily, research-driven insights through in-depth market analysis, on-chain data, and technical research.
Disclaimer: The information on this page may come from third parties and does not represent the views or opinions of Gate. The content displayed on this page is for reference only and does not constitute any financial, investment, or legal advice. Gate does not guarantee the accuracy or completeness of the information and shall not be liable for any losses arising from the use of this information. Virtual asset investments carry high risks and are subject to significant price volatility. You may lose all of your invested principal. Please fully understand the relevant risks and make prudent decisions based on your own financial situation and risk tolerance. For details, please refer to
Disclaimer.
Related Articles
Crypto Fear and Greed Index Drops to 30, Signals Panic State
Gate News message, April 25 — The Crypto Fear and Greed Index currently stands at 30, down 8 points from yesterday, according to Coinglass data. The seven-day average is 33, while the 30-day average is 18, indicating a shift toward panic sentiment in the
GateNews49m ago
Not Too Late Yet: Altcoins Eye Rapid Move Ahead of Economic Uncertainty — 5 Picks Investors Are Watching
Market rotation is splitting attention between meme coins and infrastructure-driven blockchain projects.
TAO and FIL reflect stronger alignment with emerging tech and data infrastructure narratives.
DOGE and SHIB remain primarily driven by retail sentiment and short-term volatility
CryptoNewsLand3h ago
Bitcoin Quantum Computing Threat Is Manageable, Real Issue Is Governance: Analyst
Gate News message, April 25 — Bitcoin analyst James Check said quantum computing poses a "manageable risk" rather than a systemic threat to Bitcoin, according to CoinDesk. Approximately 1.7 million BTC are held in Satoshi-era addresses, which could face risk if quantum computing breaks elliptic
GateNews4h ago
Positioned or Left Behind? Altcoins Show Pre-Breakout Momentum with 150%+ Upside — 5 Coins Worth Buying Today
Liquidity is rotating selectively into both DeFi and infrastructure tokens.
Meme assets show higher volatility compared to utility-driven protocols.
Market conditions resemble early-stage accumulation before potential expansion phases.
Market participants are observing renewed accumulati
CryptoNewsLand5h ago
Altcoins Are Not a Lottery: Why Discipline Beats Hype — Top 5 Crypto Coins Worth Buying This Cycle
Markets favor disciplined allocation over hype, with Chainlink/Uniswap tied to DeFi liquidity, and stablecoins as buffers; altcoin cycles face structural shifts amid cautious, liquidity-driven strategies.
Abstract: The article highlights a secular shift in crypto markets from speculative cycles to disciplined, liquidity-aware allocation. It links Chainlink and Uniswap activity to actual DeFi usage and liquidity trends, while stablecoins USDT and USDC serve as buffers amid uncertainty. The outlook emphasizes macro conditions and liquidity shifts as primary determinants of market direction, with institutional actors adopting structured approaches.
CryptoNewsLand6h ago
SUI Price Eyes $1.10 Breakout as Whale Positions Rise
Key Insights
SUI trades at $0.96 with RSI at 53.66, showing neutral momentum while maintaining upside room for expansion toward resistance levels.
Whale positioning at 70% long signals strong institutional confidence, aligning with rising open interest and steady capital inflows despite
CryptoNewsLand9h ago