
As the new year 2026 begins, the broader cryptocurrency market has shown modest strength over the past few hours, with both Bitcoin (BTC) and Ethereum (ETH) turning slightly green. This improvement in sentiment has started to spill over into the altcoin market as well, with several tokens attempting to build upward momentum — including Render (RENDER).
RENDER is currently up around 4% on the day, but the more compelling development lies beneath the surface. On lower timeframes, price action is beginning to highlight a constructive bullish structure that could soon pave the way for a meaningful breakout if confirmed.
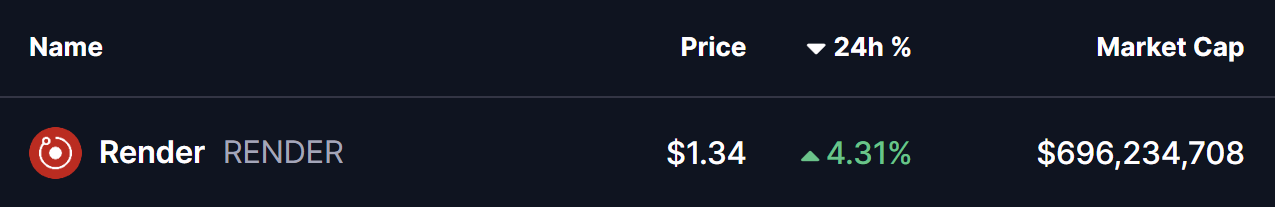
Source: Coinmarketcap
Ascending Triangle Structure Takes Shape
On the 4-hour chart, RENDER appears to be forming a textbook ascending triangle, characterized by a sequence of higher lows pressing steadily against a well-defined horizontal resistance zone. This structure is widely viewed as a bullish continuation pattern, particularly when it develops after a period of consolidation and shows signs of accumulation.
RENDER recently faced rejection near the $1.36 neckline resistance, which pushed price back toward its rising support trendline around the $1.28 region. However, each pullback has been met with strong buying interest, keeping the pattern intact and preventing any deeper breakdown. This behavior suggests that sellers are gradually losing control as buyers continue to step in at higher levels.
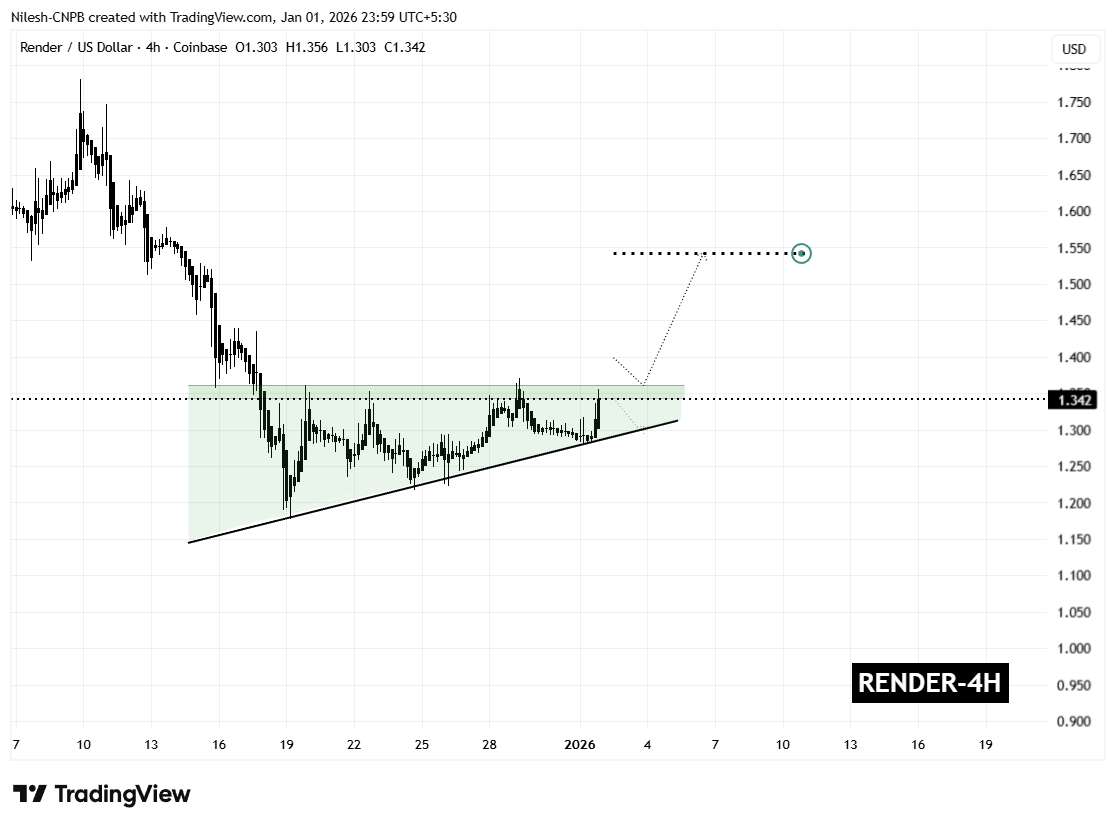
Render (RENDER) 4H Chart/Coinsprobe (Source: Tradingview)
The latest rebound has carried RENDER back toward the upper boundary of the pattern, reinforcing the idea that demand remains firm. Rather than signaling weakness, this price action points to healthy consolidation as the market tightens ahead of a potential breakout.
What’s Next for RENDER?
From here, RENDER appears to be preparing for another test of the $1.36 resistance zone. A confirmed breakout and sustained close above this level, ideally followed by a successful retest as support, would validate the ascending triangle structure and likely trigger a bullish expansion phase.
Based on the measured move of the pattern, the technical upside projection points toward the $1.54 region. This target represents a potential upside of roughly 14% from current levels and also aligns with previous price structure, strengthening the bullish case.
That said, caution remains warranted. A failure to break above resistance could result in a pullback toward the rising support trendline. As long as that trendline continues to hold, the broader bullish structure would remain intact. A decisive breakdown below support, however, would invalidate the pattern and delay any breakout scenario.
For now, the combination of improving market sentiment, persistent buying pressure, and a tightening ascending triangle structure suggests that Render is approaching a critical decision point — one that could define its next significant move as 2026 gets underway.
Disclaimer: The views and analysis presented in this article are for informational purposes only and reflect the author’s perspective, not financial advice. Technical patterns and indicators discussed are subject to market volatility and may or may not yield the anticipated results. Investors are advised to exercise caution, conduct independent research, and make decisions aligned with their individual risk tolerance.
About Author: Nilesh Hembade is the Founder and Lead Author of Coinsprobe, with over 5 years of experience in the cryptocurrency and blockchain industry. Since launching Coinsprobe in 2023, he has been providing daily, research-driven insights through in-depth market analysis, on-chain data, and technical research.
Disclaimer: The information on this page may come from third parties and does not represent the views or opinions of Gate. The content displayed on this page is for reference only and does not constitute any financial, investment, or legal advice. Gate does not guarantee the accuracy or completeness of the information and shall not be liable for any losses arising from the use of this information. Virtual asset investments carry high risks and are subject to significant price volatility. You may lose all of your invested principal. Please fully understand the relevant risks and make prudent decisions based on your own financial situation and risk tolerance. For details, please refer to
Disclaimer.
Related Articles
Why Did Bitcoin Drop Today? Dormant Whale Awakens After 11 Years and Liquidates Holdings, Hormuz Crisis Spreads
Bitcoin has recently been affected by supply shocks and geopolitical pressures, with prices declining from their highs to approximately $69,500. Large volumes of bitcoin entering exchanges have triggered market panic. Major sellers include dormant wallets resuming activity and early investors taking profits. Technically, bitcoin has broken below the $72,000 support level, with $64,000 becoming a critical support level. A breach of this level could expose the asset to further downside risk.
MarketWhisper19m ago
US-Iran Tensions Escalate, Bitcoin Viewed as "Flight Asset"
US-Iran tensions are escalating, with markets beginning to price in prolonged conflict, impacting oil, shipping, and supply chain costs. Investors are focusing on hard assets and related resource sectors, while facing stagflation risks. It is recommended to adopt defensive trading strategies and currency diversification.
GateNews32m ago
Six Countries' Joint Statement on Defending the Strait of Hormuz, But No Specifics on What to Do? Brent Crude Falls Below $110
The UK, France, Germany, Italy, the Netherlands, and Japan released a joint statement on the 19th, committing to take "appropriate measures" for navigation safety in the Strait of Hormuz, but did not specify concrete actions, leaving political flexibility. The statement condemned Iran's attacks on commercial vessels, demanded its compliance with international law, and supported increased production to stabilize energy markets. This declaration has sparked external scrutiny and analysis, particularly regarding the ambiguity of the term "appropriate measures."
動區BlockTempo48m ago
Solana Price Trend Shows Bearish Technical Pattern, Higher Time Frames Exhibit Weakness
Gate News Report: On March 20, Solana (SOL) price action displayed bearish technical formations on higher timeframes, with the market showing weakness. Technical charts indicate that SOL has formed bearish structures across multiple timeframes, with price action under pressure.
GateNews1h ago
Israel Signals De-escalation in Conflict, Oil Prices Decline, Bitcoin Rebounds After Breaking Below 69K
Israeli Prime Minister Netanyahu's speech prompted oil prices to decline and reduced market tension. The crypto market continued to weaken, with Bitcoin briefly falling below 69K. ETF outflows indicate institutional profit-taking, and the Fear and Greed Index has retreated into the fear zone.
ChainNewsAbmedia1h ago
SOL price is positioned in the $92-95 range, with the market in a recovery phase.
Gate News update: On March 19th, Solana (SOL) price is currently trading in the $92-95 range. Recent price movements indicate that the market is in a recovery phase, with prices fluctuating within this range.
GateNews3h ago
