
The Render (RENDER) price has finally shown signs of life after a long period of pressure. Price bounced from a major higher-timeframe support zone around the $1.20–$1.30 area.
These levels have acted as a floor in the past. That reaction alone caught traders’ attention, but the structure around it is what really matters.
Top analyst GEM INSIDER shared on X that this bounce didn’t happen randomly. RENDER reacted exactly where buyers were expected to step in, suggesting that selling pressure may have run its course, at least for now.
What the RENDER Chart Is Showing
On the daily chart, RENDER has been trading below a descending trendline that has capped price for months. The recent move higher started right after price tagged a key support level and quickly pushed back toward that trendline.
This matters because failed bounces usually stall early. The RENDER price didn’t. It moved with intent, reclaiming short-term levels instead of drifting sideways. That kind of response often points to real demand rather than a weak relief rally.
The trendline above is now the final obstacle. A clean break would mark a clear shift in structure, turning resistance into open space.
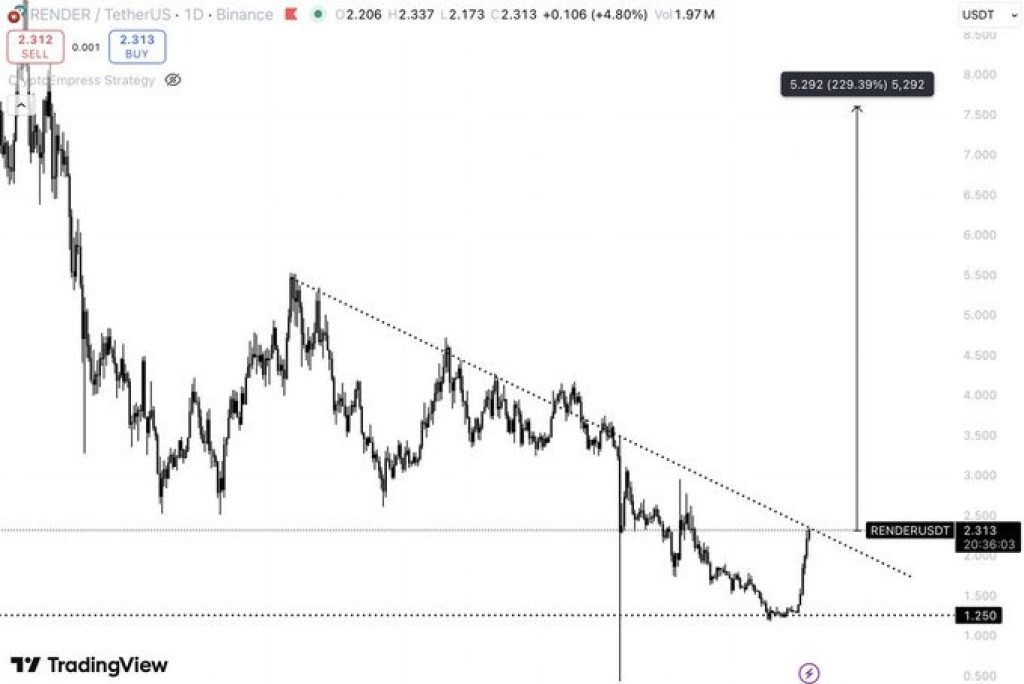
Source: X/GemInsider
Why the Bottom May Be In For RENDER Price
One of the strongest signals here is how price behaved at support. Instead of slicing through it, RENDER snapped higher. That kind of reaction often shows that sellers are exhausted and buyers are willing to defend levels aggressively.
There is also very little structure above the current price. If the RENDER price breaks the last descending trendline, there are few obvious resistance zones until much higher levels. That’s what traders mean when they say “air above.”
This doesn’t guarantee a straight move higher, but it does explain why momentum could accelerate quickly if the breakout sticks.
_****Here’s Why Dogwifhat (WIF) Price Is Pumping Hard Today**
Moreover, the focus is now on the trendline. Acceptance above it would confirm a structural shift and increase the odds that the recent low marks a meaningful bottom.
Failure there would likely send the RENDER price back into consolidation, but as long as support holds, the downside looks more controlled.
For now, RENDER has done the most important thing it needed to do. It defended a major floor. If buyers follow through, the next move may not take long to show itself.
Disclaimer: The information on this page may come from third parties and does not represent the views or opinions of Gate. The content displayed on this page is for reference only and does not constitute any financial, investment, or legal advice. Gate does not guarantee the accuracy or completeness of the information and shall not be liable for any losses arising from the use of this information. Virtual asset investments carry high risks and are subject to significant price volatility. You may lose all of your invested principal. Please fully understand the relevant risks and make prudent decisions based on your own financial situation and risk tolerance. For details, please refer to
Disclaimer.
Related Articles
HOT Climbs to $0.0004141, Its Falling Wedge Breakout Sets to Push Price 300% Higher: Analyst
The Holo (HOT) coin is showing bullish signals, with analysts predicting a significant price increase due to a breakout from a falling wedge pattern. Recent trends indicate rising interest and market activity, positioning HOT for potential gains soon.
BlockChainReporter17m ago
Bitcoin Cash Battles $459 Resistance as Massive Sell Walls Stack Toward $650
BCH is trading at $455.86 close to the resistance range of $459.20 with the support level of $447.44.
The chart data indicates that the chart has strong resistance levels at around $520, $580 and $650 which restricts the momentum on short term upside.
Following a sharp fall, price
CryptoNewsLand51m ago
HYPE Hits $35.53 After 2.4% Jump — Will Momentum Hold as Price Tests $35.59 Resistance?
Hyperliquid’s HYPE trades at $35.53, approaching the $35.59 resistance after a 2.4% daily gain.
The chart shows the $33.67 zone acting as support after price moved above a previously contested level.
Price now trades between $33.67 support and $35.59 resistance, shaping the immediate
CryptoNewsLand1h ago
Is Injective (INJ) a Dead Coin or the Next 2800% Opportunity? Here’s What The Chart Is Saying
The Injective price has fallen sharply from its previous all-time high, leading some traders to question whether the project has lost its momentum.
However, a recent technical analysis shared by top analyst Crypto Patel suggests that the recent decline may actually represent a typical
CaptainAltcoin2h ago
CFX 4-hour chart reaches a new high for the phase, with approximately 14% increase over 24 hours
Gate News: On March 15, market data shows that CFX reached a new phase high on the 4-hour K-line chart, with prices touching approximately 0.06282 USDT at their peak, representing a 24-hour gain of around 14%. Some community members believe this rally may be related to recent macroeconomic catalysts. Earlier, media outlets citing sources reported that Iran is considering allowing certain tankers to pass through the Strait of Hormuz on the condition that petroleum transport be settled in Chinese yuan. Related discussions have once again sparked market attention toward yuan stablecoins and cross-border payment narratives.
GateNews3h ago