
**Date: **Sat, Jan 03, 2026 | 01:26 PM GMT
As 2026 kicks off, the broader cryptocurrency market is showing renewed stability. Ethereum (ETH) has reclaimed the $3,100 level, and several major altcoins are already beginning to pick up momentum. Against this improving backdrop, Kaspa (KAS) is quietly positioning itself as a potential late mover, with its chart structure starting to flash early bullish signals.
While KAS is trading slightly in the red today and remains mostly flat on the weekly timeframe, the more important story is unfolding beneath the surface. Recent price action suggests a meaningful structural shift may be underway — one that could mark the early stages of a bullish continuation if confirmed.
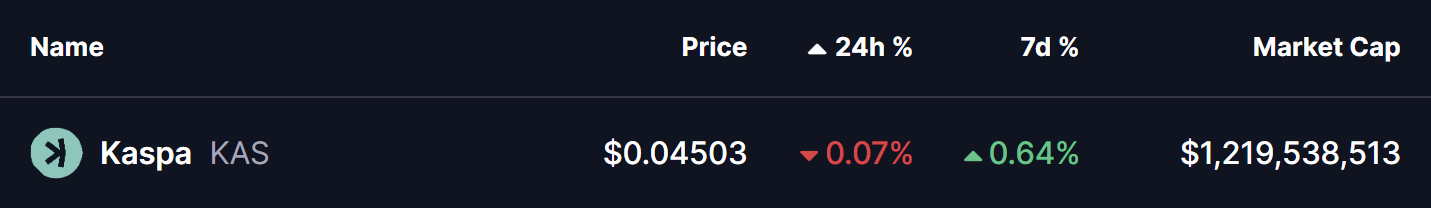
Source: Coinmarketcap
Rounding Bottom in Play
On the 4-hour timeframe, Kaspa appears to be forming a rounding bottom pattern, a classic bullish reversal structure that typically develops after a prolonged corrective phase. This pattern reflects a slow but steady transition from distribution to accumulation, as selling pressure weakens and buyers gradually regain control.
The setup began after KAS faced strong rejection near the $0.06310 neckline zone, which triggered a sharp decline through late November and December. That downside move eventually found strong demand near the $0.040 level, which has since acted as a key support area. Multiple defenses of this zone prevented further downside and helped establish a stable base for a potential trend reversal.
Since carving out that bottom, KAS has started to curve higher in a smooth, rounded fashion — closely matching the textbook structure of a developing rounding bottom. The recent stabilization above the $0.045 region further supports the idea that downside momentum is fading.
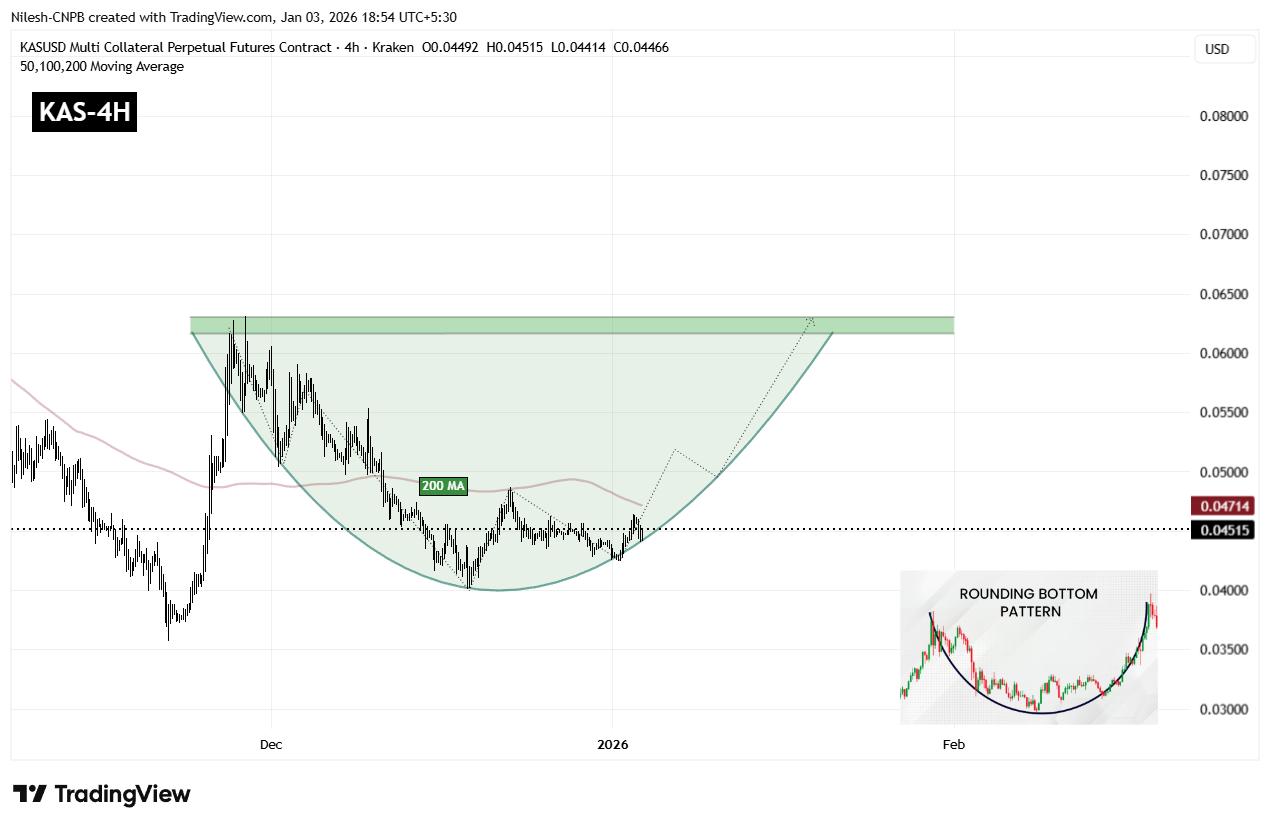
Kaspa (KAS) 4H Chart/Coinsprobe (Source: Tradingview)
A key technical level now comes into focus: the 200-period moving average, currently hovering near $0.04714. This level has acted as dynamic resistance during the recovery phase, and reclaiming it would mark an important shift in short-term market structure.
A sustained move above the 200 MA would indicate that buyers are regaining control after months of corrective price action and could act as the trigger for a stronger upside continuation.
What’s Next for KAS?
For full confirmation of the rounding bottom pattern, KAS must eventually reclaim the $0.06310 neckline resistance. A clean breakout above this zone would validate the entire reversal structure and could open the door to a broader bullish expansion phase, with momentum traders likely re-entering the market.
Until that breakout occurs, the pattern remains in development. Short-term consolidation or shallow pullbacks remain possible, especially near moving average resistance. However, as long as price continues to hold above the $0.04245 support base and maintains higher lows, the broader bottoming structure remains intact and constructive.
In the near term, all eyes remain on the 200 MA and the neckline zone. How Kaspa reacts around these levels will likely determine whether this emerging bullish setup evolves into a confirmed breakout move or requires more time to mature.
Disclaimer: The views and analysis presented in this article are for informational purposes only and reflect the author’s perspective, not financial advice. Technical patterns and indicators discussed are subject to market volatility and may or may not yield the anticipated results. Investors are advised to exercise caution, conduct independent research, and make decisions aligned with their individual risk tolerance.
About Author: Nilesh Hembade is the Founder and Lead Author of Coinsprobe, with over 5 years of experience in the cryptocurrency and blockchain industry. Since launching Coinsprobe in 2023, he has been providing daily, research-driven insights through in-depth market analysis, on-chain data, and technical research.
Disclaimer: The information on this page may come from third parties and does not represent the views or opinions of Gate. The content displayed on this page is for reference only and does not constitute any financial, investment, or legal advice. Gate does not guarantee the accuracy or completeness of the information and shall not be liable for any losses arising from the use of this information. Virtual asset investments carry high risks and are subject to significant price volatility. You may lose all of your invested principal. Please fully understand the relevant risks and make prudent decisions based on your own financial situation and risk tolerance. For details, please refer to
Disclaimer.
Related Articles
Fear and Greed Index Returns Above 40, BTC Weekly Gains 5.66%, ETH Weekly Gains 13%
Data from Xinfire Research Institute shows that from March 11-18, the Nasdaq index declined 1.26%, Bitcoin rose 5.66%, and Ethereum gained 13%. The Fear and Greed Index has exited the extreme fear zone. The Federal Reserve will release statements related to rate cuts tomorrow.
GateNews13m ago
Bitcoin Pulls Back to $73,500, Ethereum Consolidates at $2,300, CryptoQuant: Uptrend Faces Double Resistance, Fed Decision Thursday Becomes Key
Bitcoin reached a high of 75,500 USD today before pulling back to 73,910 USD. CryptoQuant points out that there is double resistance in the 75,000 to 85,000 USD range. The market is awaiting the Federal Reserve's interest rate decision announcement and Powell's assessment of stagflation. If the results are hawkish, it will increase resistance at the 75,000 USD level. Overall market sentiment remains consolidating sideways.
動區BlockTempo1h ago
CryptoQuant Alert: Bitcoin Bounce May Face Resistance Between 75,000 and 85,000 USD
CryptoQuant report shows bullish signals in the Bitcoin futures market, but if the price continues to rise, it will encounter resistance near $75,000 and $85,000. Meanwhile, the inflow of Bitcoin into centralized exchanges is accelerating, which may signal potential selling pressure, creating a contradiction with the bullish sentiment in the futures market.
MarketWhisper1h ago
Why Did Bitcoin Fall Today? Iran's Key Leader Dies, Hormuz Strait Faces Blockade Again
Recent reasons for Bitcoin's decline include geopolitical conflict uncertainty triggered by the death of Iranian wartime official Larijani, the blockade of the Strait of Hormuz pushing oil prices above $100, exacerbating inflation pressures and reducing Federal Reserve rate cut expectations, as well as institutional capital withdrawal. On the technical side, $72,000 is an important support level, and a break below could lead to further exploration toward $64,000.
MarketWhisper1h ago
Today's cryptocurrency fear and greed index fell to 26, with the market in a state of panic
Gate News Report: On March 18, Alternative.me data shows that today's cryptocurrency fear and greed index dropped to 26, with the market in a "panic state." Yesterday, the index was at 28, also in a "panic state."
GateNews2h ago
Market Awaits Fed Decision as Bitcoin Consolidates at $74,000 High
Middle East tensions remain elevated, with investors focusing on the impact of high oil prices on inflation and the Fed's interest rate decision. U.S. stocks rose slightly, with energy stocks performing well, while Bitcoin consolidated around thousand dollars. Markets expect the Fed to hold rates steady, with attention on Powell's remarks.
GateNews2h ago
